标签:inline 指定 默认 创建 temp 变量 figure 趋势 lod
import numpy as np
import matplotlib.pyplot as plt
#魔法指令,让绘制出来的图例展示在当前文件中
%matplotlib inline
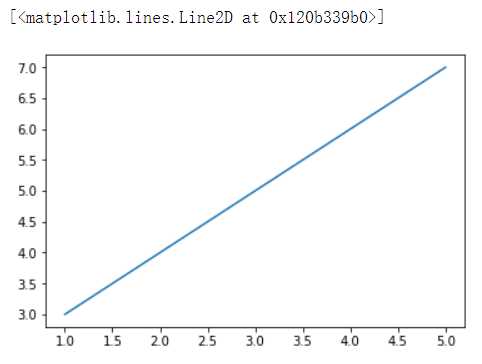
x = np.array([1,2,3,4,5])
y = x + 2
plt.plot(x,y)
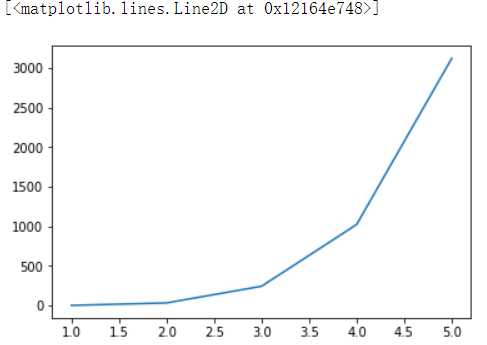
x = x
y = x ** 5
plt.plot(x,y)
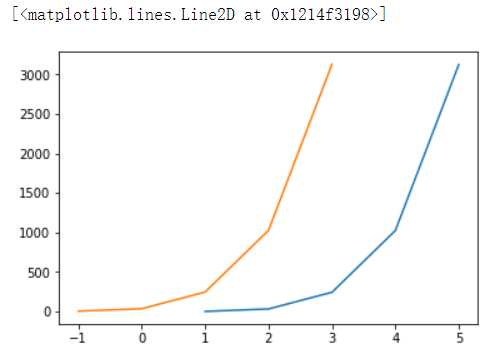
#在一个坐标系中绘制多条曲线
plt.plot(x,y)
plt.plot(x-2,y+3)
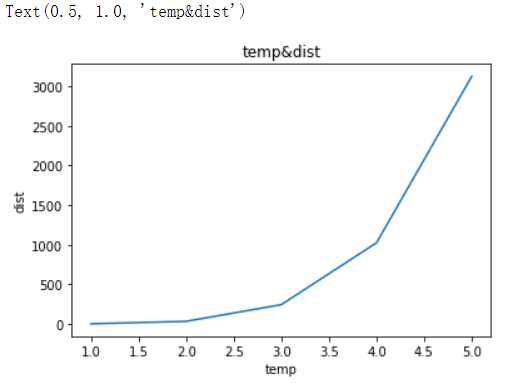
#这坐标系设置表示
plt.plot(x,y)
plt.xlabel(‘temp‘)
plt.ylabel(‘dist‘)
plt.title(‘temp&dist‘)
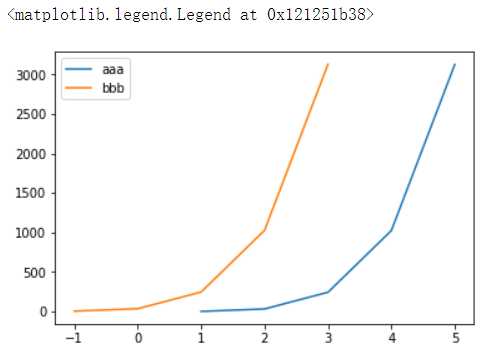
#设置图例
plt.plot(x,y,label=‘aaa‘)
plt.plot(x-2,y+3,label=‘bbb‘)
plt.legend()
#等比例的放大或者缩小坐标系(坐标的刻度是不会发生改变)
plt.figure(figsize=(15,10)) #一定写在绘图操作之前
plt.plot(x,y,label=‘aaa‘)
plt.plot(x-2,y+3,label=‘bbb‘)
plt.legend()
#保存图像
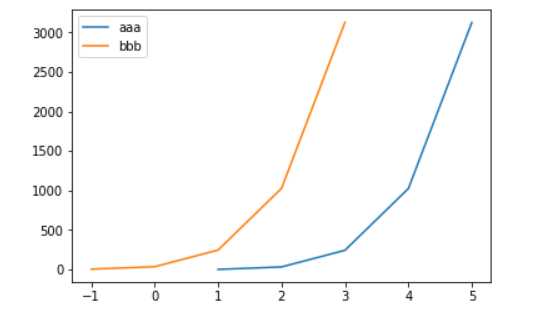
fig = plt.figure() #1.实例化对象
#2.绘图
plt.plot(x,y,label=‘aaa‘)
plt.plot(x-2,y+3,label=‘bbb‘)
plt.legend()
#3.保存图片
fig.savefig(‘./123.png‘)
x = [1,2,3,4,5]
y = [3,8,5,7,6] #柱高
plt.bar(x,y)
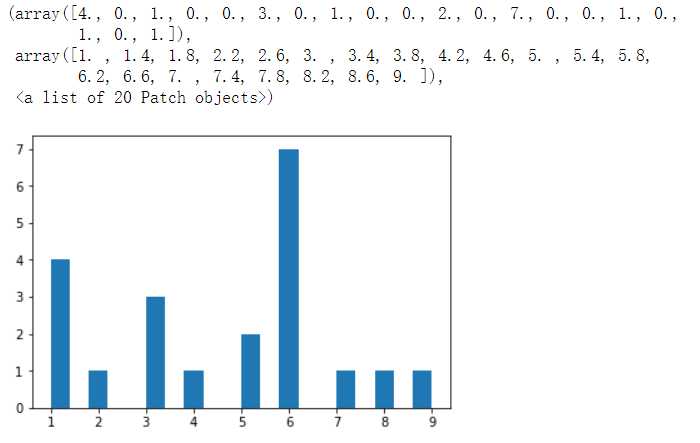
x = [1,1,1,1,2,3,3,3,4,5,5,6,6,6,6,6,6,6,7,8,9]
plt.hist(x,bins=20) #bins表示柱子的个数 上面的array 是区间范围内数的个数 下面的array 是 以柱子个数分的区间
arr=[11,22,31,15]
plt.pie(arr)
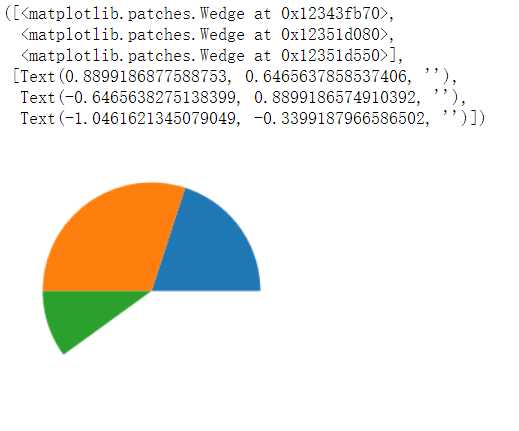
arr=[0.2,0.3,0.1]
plt.pie(arr)
arr=[11,22,31,15]
plt.pie(arr,labels=[‘a‘,‘b‘,‘c‘,‘d‘])
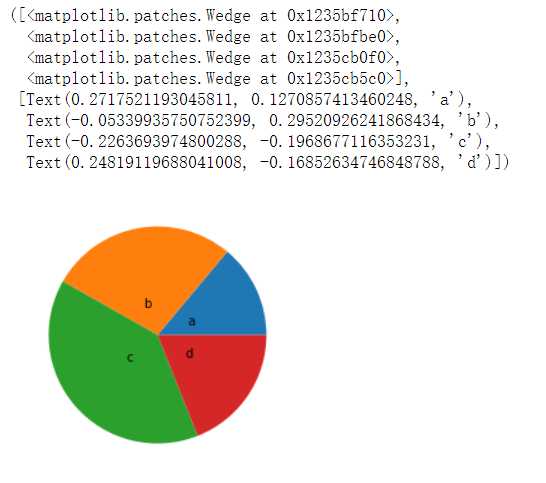
arr=[11,22,31,15]
plt.pie(arr,labels=[‘a‘,‘b‘,‘c‘,‘d‘],labeldistance=0.3,autopct=‘%.6f%%‘)
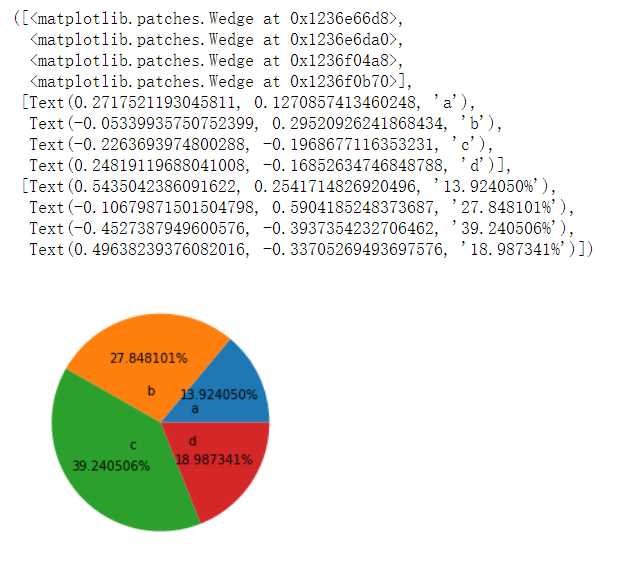
arr=[11,22,31,15]
plt.pie(arr,labels=[‘a‘,‘b‘,‘c‘,‘d‘],labeldistance=0.3,shadow=True,explode=[0.2,0.3,0.2,0.4])
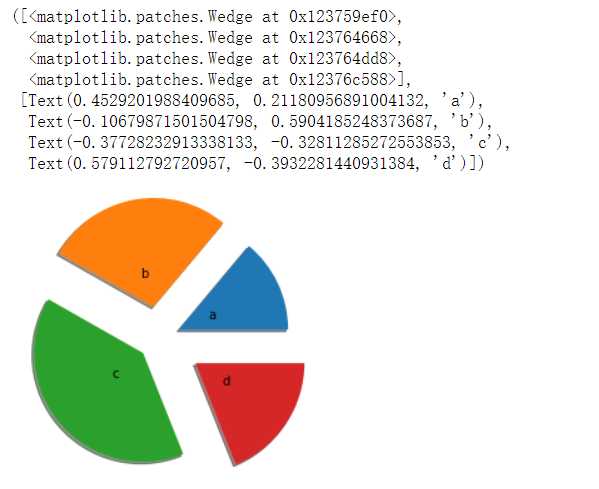
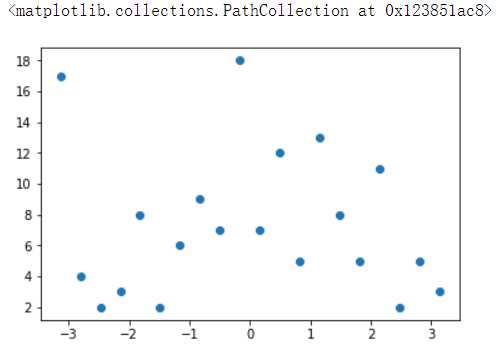
x = np.linspace(-np.pi,np.pi,num=20)
y = np.random.randint(0,20,size=(20,))

plt.scatter(x,y)
标签:inline 指定 默认 创建 temp 变量 figure 趋势 lod
原文地址:https://www.cnblogs.com/linranran/p/13308453.html