码迷,mamicode.com
首页 > 其他好文 > 详细

echarts图表样式

时间:2020-08-17 17:54:35      阅读:95      评论:0      收藏:0      [点我收藏+]

标签:显示   png   off   分隔线   new   format   lazy   isl   仪表   

var normal=100,all=100;
option = {
    // backgroundColor: ‘#0d1e1a‘,
      title: [{
        text: ‘完成‘,
        x: ‘center‘,
        top: ‘32%‘,
        left:‘40%‘,
        textStyle: {
            color: ‘#C1C1C1‘,
            fontSize: 20,
            fontWeight: ‘100‘,
        }
    }, {
        text: ‘60%‘,
        x: ‘center‘,
       top: ‘31%‘,
        left:‘45%‘,
        textStyle: {
            fontSize: ‘30‘,
            color: ‘#ffffff‘,
            fontFamily: ‘Lato‘,
            foontWeight: ‘600‘,
        },
    },
    {
        text: ‘维修‘,
        x: ‘center‘,
         top: ‘75%‘,
        left:‘35%‘,
        textStyle: {
            color: ‘#C1C1C1‘,
            fontSize: 20,
            fontWeight: ‘100‘,
        }
    }],
    series: [
        {
            name: "刻度",
            type: "gauge",
            center: ["10%", "50%"],
            radius: ‘50%‘,
            min: 0, //最小刻度
            max: 100, //最大刻度
            splitNumber: 10, //刻度数量
            startAngle: 90,
            endAngle:-90,
            axisLine: {
                show: true,
                lineStyle: {
                    width: 1,
                    color: [
                        [1, "rgba(0,0,0,0)"]
                    ],
                },
            }, //数值文字
            axisLabel: {
                show: true,
                color: "#0071C8",
                fontSize: 15,
                distance: -50,
                formatter: function(v) {
                    return v;
                },
            }, //内刻度线
            axisTick: {
                show: true,
                splitNumber: 5,
                lineStyle: {
                    color: "#0071C8",
                    width: 1,
                    // length:10
                },
                length: -20,
            }, //分隔刻度线
            splitLine: {
                show: true,
                length: -20,
                lineStyle: {
                    color: "#0071C8",
                    width: 2
                },
            }, //分隔线样式
        },
        {
            type: "gauge",
            radius: ‘60%‘,
            center: ["10%", "50%"],
            splitNumber: 0, //刻度数量
            startAngle: 90,
            endAngle:-90,
            axisLine: {
                show: true,
                lineStyle: {
                    width: 10,
                    color: [
                        [
                            1, new echarts.graphic.LinearGradient(
                                0, 0, 1, 0, [{
                                        offset: 0,
                                        color: ‘#757F9A‘,
                                    },
                                    {
                                        offset: 0.2,
                                        color: ‘#757F9A‘,
                                    }
                                ]
                            )
                        ],
                    ],
                },
            },
            //分隔线样式。
            splitLine: {
                show: false,
            },
            axisLabel: {
                show: false,
            },
            axisTick: {
                show: false,
            },
            pointer: {
                show: true,
                length: "2%",
                width: "2%",
            },
            title: {
                show: false,
               
            },
            //仪表盘详情,用于显示数据。
            detail: {
                show: false,
               
            }
            
        },
        {
            type: "gauge",
            radius: ‘60%‘,
            center: ["10%", "50%"],
            splitNumber: 0, //刻度数量
            startAngle: 20,
            endAngle:-90,
            axisLine: {
                show: true,
                lineStyle: {
                    width: 10,
                    color: [
                        [
                            1, new echarts.graphic.LinearGradient(
                                0, 0, 1, 0, [{
                                        offset: 0,
                                        color: ‘#0071C8‘,
                                    },
                                    {
                                        offset: 1,
                                        color: ‘#03DDFF‘,
                                    }
                                ]
                            )
                        ],
                    ],
                },
            },
            //分隔线样式。
            splitLine: {
                show: false,
            },
            axisLabel: {
                show: false,
            },
            axisTick: {
                show: false,
            },
            pointer: {
                show: true,
                length: "2%",
                width: "2%",
            },
             title: {
                show: false,
               
            },
            //仪表盘详情,用于显示数据。
            detail: {
                show: false,
               
            }
        },
        {
            type: "gauge",
            radius: ‘85%‘,
            center: ["10%", "50%"],
            splitNumber: 0, //刻度数量
            startAngle: 5,
            endAngle:-25,
            axisLine: {
                show: true,
                lineStyle: {
                    width: 2,
                    color: [
                        [
                            1, new echarts.graphic.LinearGradient(
                                0, 0, 1, 0, [{
                                        offset: 0,
                                        color: ‘#0091C8‘,
                                    },
                                    {
                                        offset: 1,
                                        color: ‘#0091C8‘,
                                    }
                                ]
                            )
                        ],
                    ],
                },
            },
            //分隔线样式。
            splitLine: {
                show: false,
            },
            axisLabel: {
                show: false,
            },
            axisTick: {
                show: false,
            },
            pointer: {
                show: true,
                length: "2%",
                width: "2%",
            },
             title: {
                show: false,
               
            },
            //仪表盘详情,用于显示数据。
            detail: {
                show: false,
               
            }
        }
    ],
};
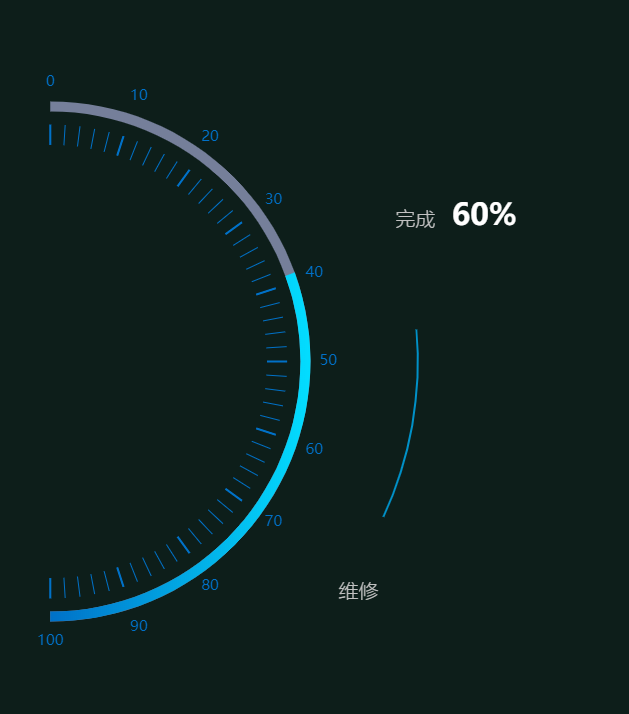
技术图片


echarts图表样式

标签:显示   png   off   分隔线   new   format   lazy   isl   仪表   

原文地址:https://www.cnblogs.com/srx121201/p/13509179.html

(0)
(0)
   
举报
评论 一句话评论(0
登录后才能评论!
© 2014 mamicode.com 版权所有  联系我们:gaon5@hotmail.com
迷上了代码!