
标签:name end roman seconds rgba second orm info src
clc;close all;clear;
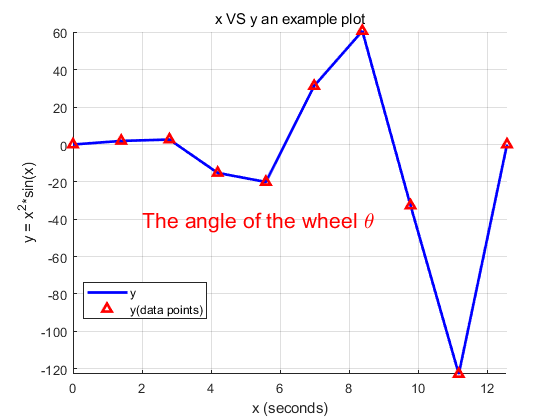
x =linspace(0,4*pi,10);
y = x.^2.*sin(x);
figure
hold on
plot(x,y,‘b-‘,‘linewidth‘,2)
plot(x,y,‘r^‘,‘linewidth‘,2)
xlabel(‘x (seconds)‘)
ylabel(‘y = x^2*sin(x)‘)
grid on
title(‘x VS y an example plot‘)
legend(‘y‘,‘y(data points)‘,‘location‘,‘best‘)
axis([min(x) max(x) min(y) max(y)])
text(2,-40,‘The angle of the wheel \theta‘,‘color‘,‘r‘,‘FontSize‘,16,‘FontName‘,‘Time News Roman‘)


% histogram 直方图
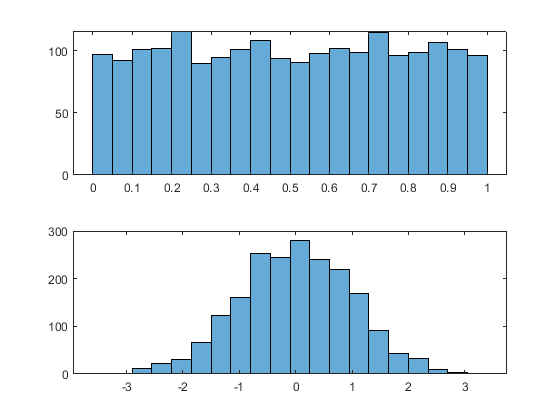
N = 2000;
numBins = 20;
sampleuniform = rand(1,N);
sampleNorm = randn(1,N);
figure
subplot(2,1,1)
histogram(sampleuniform,numBins);%numBins默认是10个
subplot(2,1,2)
histogram(sampleNorm,numBins);

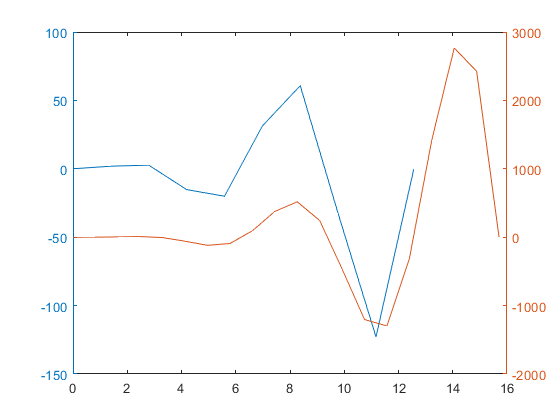
%% plotyy 方便对变化范围差异较大的两幅图进行比较
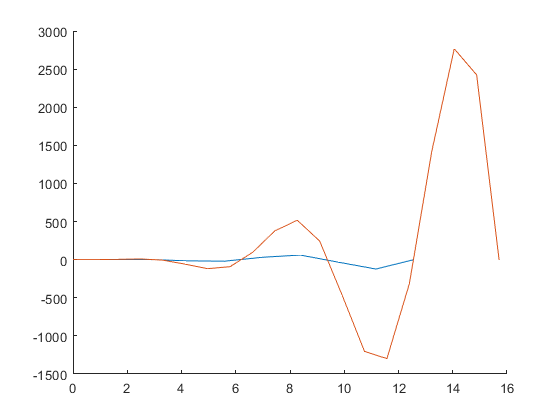
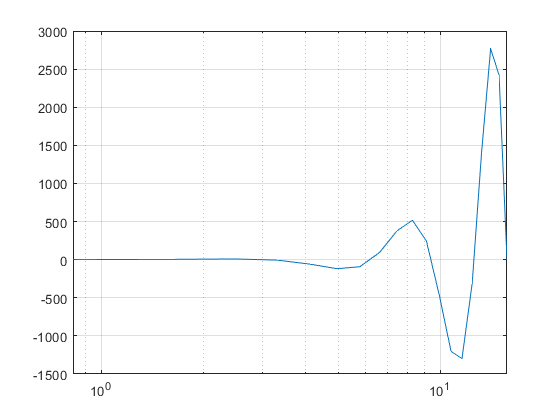
x2 = linspace(0,5*pi,20);
y2 = x2.^3.*sin(x2);

figure
hold on
plot(x,y)
plot(x2,y2)

figure
plotyy(x,y,x2,y2)

%% semilogx
figure
semilogx(x2,y2)
grid on


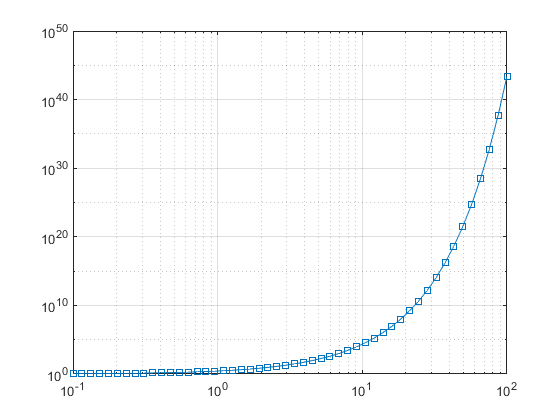
%%loglog()
figure
x3 = logspace(-1,2);
%logspace(a,b)创建10^a到10^b之间分为50份默认的,logspace(a,b,n)创建10^a到10^b之间分为n份
loglog(x3,exp(x3),‘-s‘)
grid on

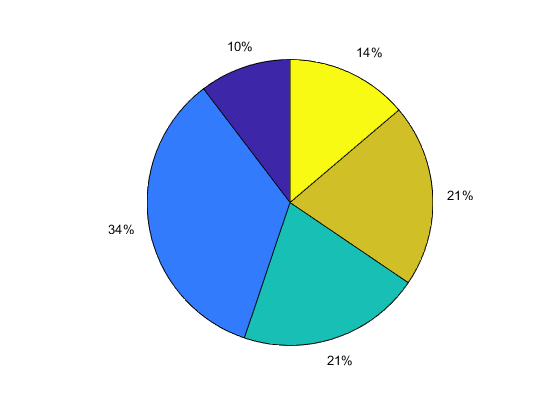
%% pie 饼图
figure
sales = [15 50 30 30 20];
pie(sales)

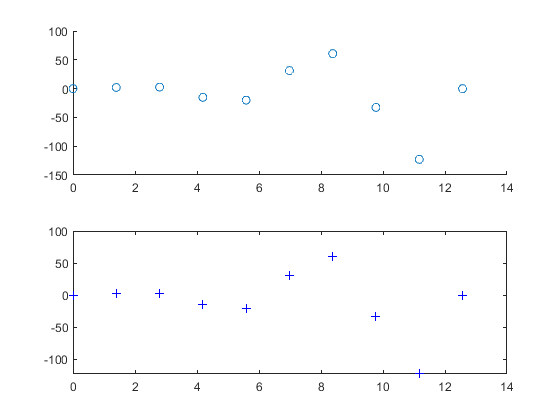
%% scatter
figure
subplot(2,1,1)
scatter(x,y)
subplot(2,1,2)
plot(x,y,‘b+‘)
标签:name end roman seconds rgba second orm info src
原文地址:https://www.cnblogs.com/csymemory/p/13764449.html
