标签:figure which command market fir select sid key ace
原文:https://code.visualstudio.com/docs/nodejs/reactjs-tutorial
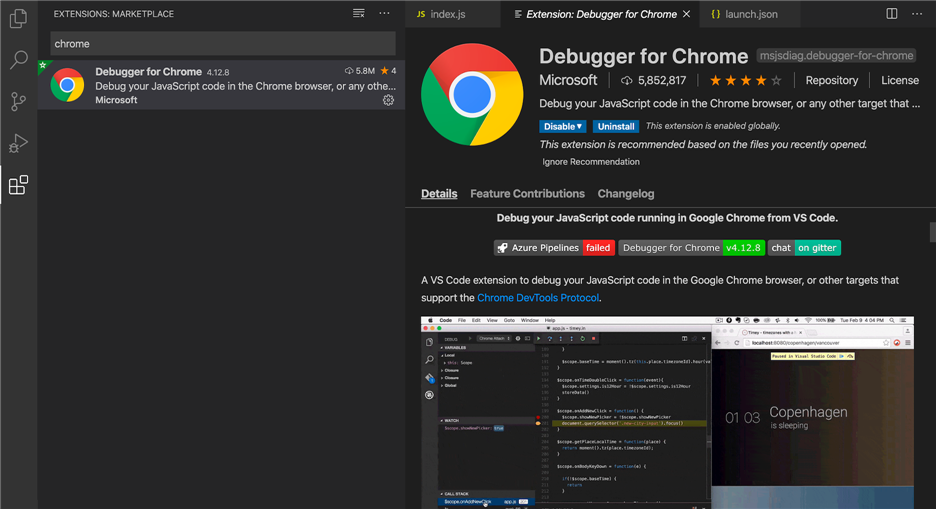
To debug the client side React code, we‘ll need to install the Debugger for Chrome extension.
Note: This tutorial assumes you have the Chrome browser installed. There are also debugger extensions for the Edge and Firefox browsers.
Open the Extensions view (Ctrl+Shift+X) and type ‘chrome‘ in the search box. You‘ll see several extensions which reference Chrome.

Press the Install button for Debugger for Chrome.
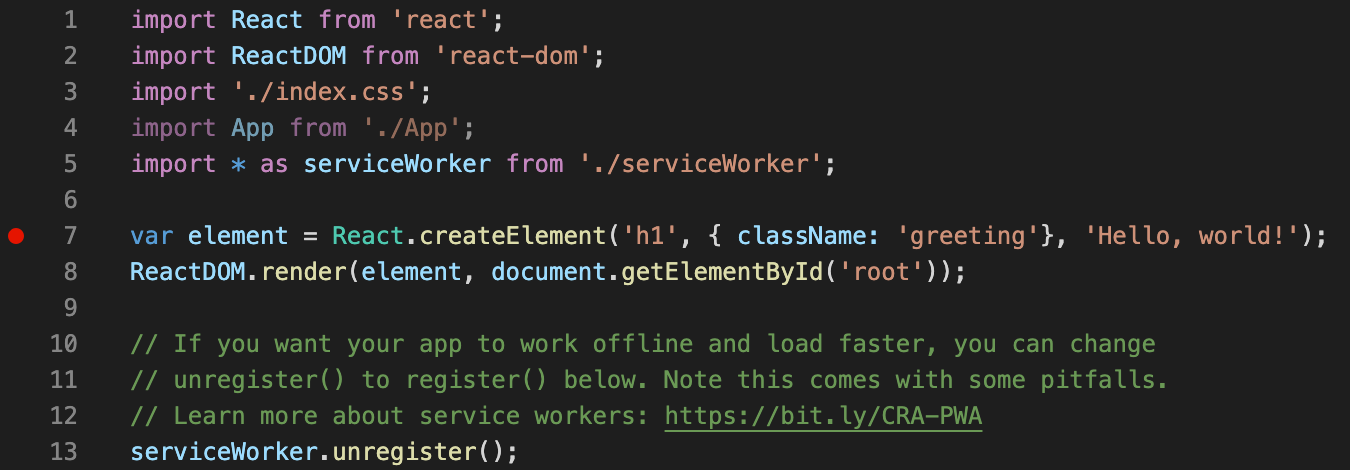
To set a breakpoint in index.js, click on the gutter to the left of the line numbers. This will set a breakpoint which will be visible as a red circle.

We need to initially configure the debugger. To do so, go to the Run view (Ctrl+Shift+D) and click create a launch.json file to customize Run and Debug. Choose Chrome from the Select Environment drop-down list. This will create a launch.json file in a new .vscode folder in your project which includes a configuration to launch the website.
We need to make one change for our example: change the port of the url from 8080 to 3000. Your launch.json should look like this:
{
  "version": "0.2.0",
  "configurations": [
    {
      "type": "chrome",
      "request": "launch",
      "name": "Launch Chrome against localhost",
      "url": "http://localhost:3000",
      "webRoot": "${workspaceFolder}"
    }
  ]
}
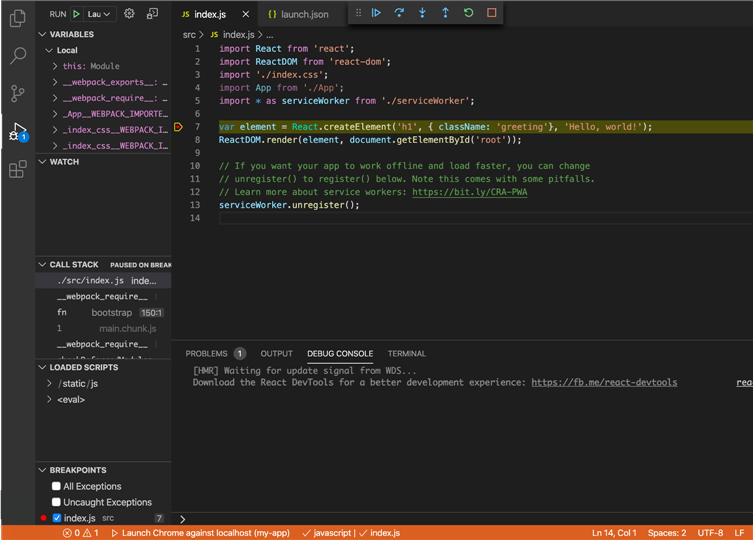
Ensure that your development server is running (npm start). Then press F5 or the green arrow to launch the debugger and open a new browser instance. The source code where the breakpoint is set runs on startup before the debugger was attached, so we won‘t hit the breakpoint until we refresh the web page. Refresh the page and you should hit your breakpoint.

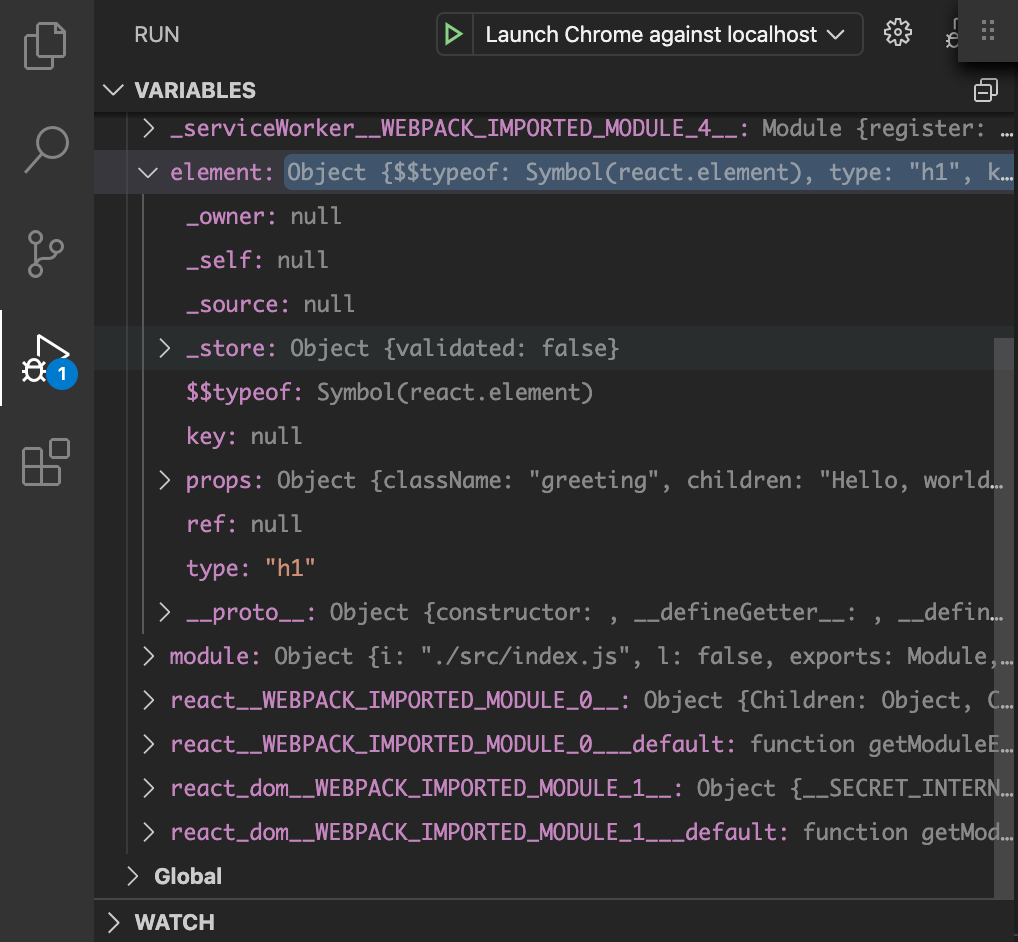
You can step through your source code (F10), inspect variables such as element, and see the call stack of the client side React application.

The Debugger for Chrome extension README has lots of information on other configurations, working with sourcemaps, and troubleshooting. You can review it directly within VS Code from the Extensions view by clicking on the extension item and opening the Details view.

react debug from VS Code —— the Debugger for Chrome extension
标签:figure which command market fir select sid key ace
原文地址:https://www.cnblogs.com/panpanwelcome/p/14537657.html