原作者文章链接:http://www.homolog.us/blogs/blog/2011/07/31/de-bruijn-graphs-iii/
De Bruijn Graphs – III
In earlier commentaries, we introduced the concept of de Bruijn graphs and showed how they were used for de novo assembly of short read sequences. If you read the posts, you likely left with an impression that de Bruijn graphs were useful weapons to be included in all bioinformaticians‘ arsenals. However, none of the posts clearly explained, why they became the primary weapons applied by all popular short read assemblers. Let us do that at the outset here.
We
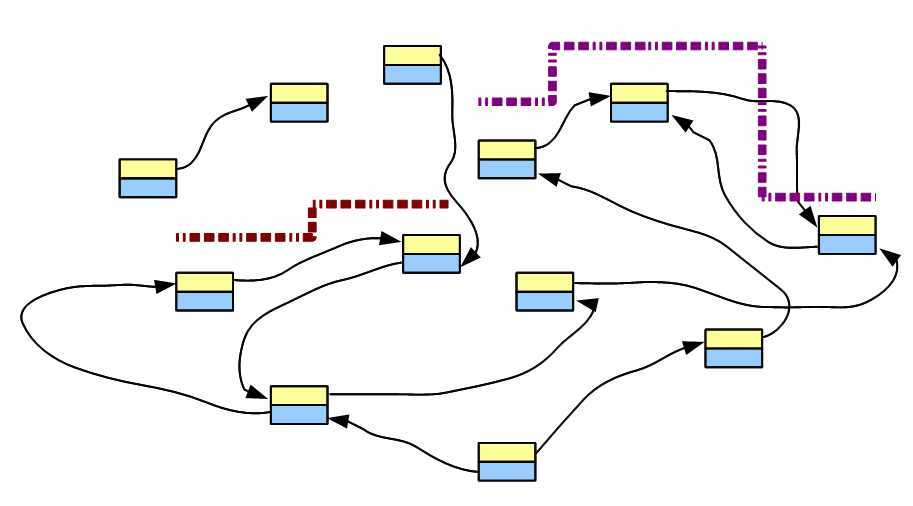
will borrow the following figure from our previous post.
It
shows de Bruijn graph of a genome, and few short reads aligned to the genome and
the de Bruijn graph. Like before, we will restrict our discussions to the
perfect world with no countries, no religion, no greed
or hunger and, most importantly, no sequencing
error.
If all reads are perfect, they will all match the de Bruijn graph
of the genome and there is no need to add any node or link. Therefore,
irrespective of whether we sequence the genome at 10X depth or 1000X depth, the
size of the de Bruijn graph is limited by the size of the underlying genome, not
volume of data. This conclusion is unchanged, whether we knew the genome
beforehand, or we are trying to assemble it de novo from short read data.
Think about the implications of the above observation. Researchers often ask, how much RAM they would need to assemble a genome from HiSeq data. With an assembly algorithm relying on de Bruijn graphs, the answer depends on the size of genome being assembled, not the volume of sequence data. Assembling an yeast genome from three lanes of HiSeq data will need far less RAM than assembling a vertebrate genome.
However, we do not live in the perfect world and all sequencing libraries have some degree of error. In the next post, we will discuss, how sequencing errors can change the structure of the de Bruijn graph and increase memory requirement. Even with erroneous reads, next-gen assembly programs found that using de Bruijn graphs is the least memory-intensive way to operate on so many reads, given computer memory has become the key bottleneck.
De Bruijn Graphs – III,布布扣,bubuko.com
原文地址:http://www.cnblogs.com/xiahualin/p/3737946.html