标签:style blog http io ar color os 使用 sp
最近学习了matplotlib的内容,在这里做一些总结。
参考:vamei博客(Python的也可以看其教程)http://www.cnblogs.com/vamei/archive/2013/01/30/2879700.html
http://reverland.org/python/2012/09/07/matplotlib-tutorial/
http://myshare.dscloud.me/scipydoc/matplotlib_intro.html#axis(这个文章很好的解释了figure,axes,subplot,axis等之间的关系,还有最终的artist对象,感觉这个是必看)
官方的文档:http://matplotlib.org/index.html
一、一些例子pyqt4+matplotlib
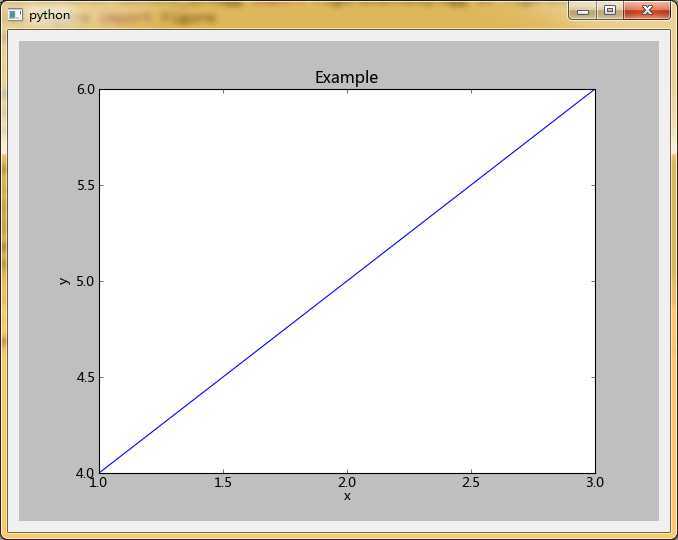
example1 : 将matplolib作为一个widget对象显现,这样也可以插入到qt的布局中,所有的matplotlib都可以以这种形式呈现。有个plt.gcf()的方法我经常使用,这个是获取当前的figure,如果你有多figure的话,只显示当前状态的,当然也有方法去显示多figure。使用plt.gcf().clear()可以让figure上的对象消失,我采用这个方法实现的重绘,不知道有没有其他更好的方法。

 1 #_*_coding:utf-8_*_
 2 ‘‘‘
 3 Created on 2014年12月10日
 4
 5 @author: Administrator
 6 ‘‘‘
 7 from PyQt4.QtCore import *
 8 from PyQt4.QtGui import *
 9 from matplotlib.backends.backend_qt4agg import FigureCanvasQTAgg as figureCanvas
10 from matplotlib.figure import Figure
11 import matplotlib.pyplot as plt
12 import sys
13
14 class DrawWidget(QWidget):
15     def __init__(self,parent=None):
16         super(DrawWidget,self).__init__(parent)
17
18         figure = plt.gcf() #返回当前的figure
19         self.canvas = figureCanvas(figure)
20         x = [1,2,3]
21         y = [4,5,6]
22         plt.plot(x,y)
23         plt.title(‘Example‘)
24         plt.xlabel(‘x‘)
25         plt.ylabel(‘y‘)
26         self.canvas.draw()
27         layout = QHBoxLayout(self)
28         layout.addWidget(self.canvas)
29
30
31 if __name__ == ‘__main__‘:
32     app = QApplication(sys.argv)
33     ui = DrawWidget()
34     ui.show()
35     app.exec_()
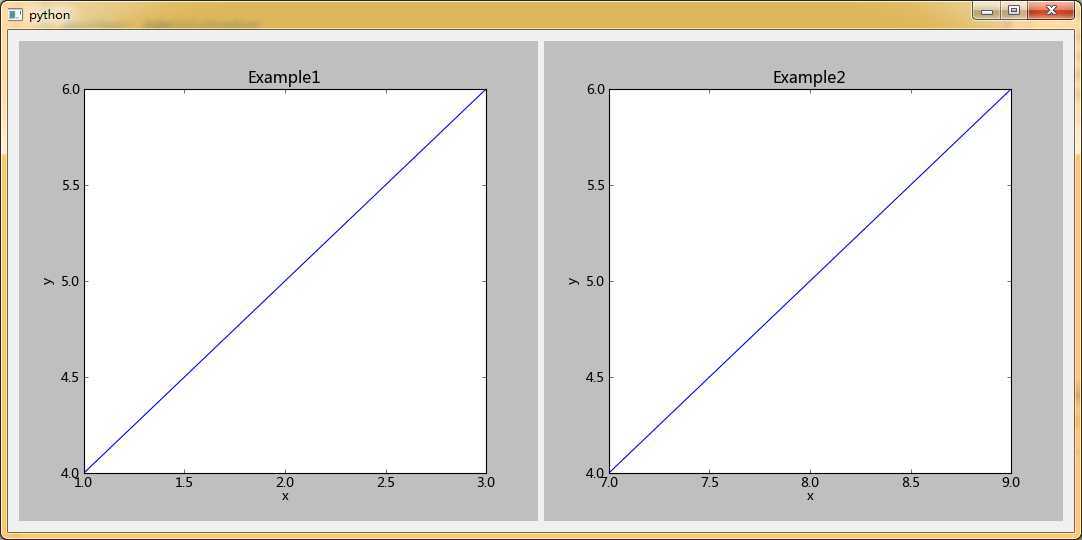
example2: 多figure在widget上的显示,我用了一种比较笨的方法,采用了多canvas和多figure的办法,然后在widget上面使用布局管理器控制布局,我记得是有一种方法可以用一个canvas将多figure显示出来的,方法记不起来了,就附上这个比较笨的替代方法。(代码中可以忽略class Example这一段,这些是不同的widget,最后widgetObject.show()方法显示指定的widget)

 1 #_*_coding:utf-8_*_
 2 ‘‘‘
 3 Created on 2014年12月10日
 4
 5 @author: Administrator
 6 ‘‘‘
 7 from PyQt4.QtCore import *
 8 from PyQt4.QtGui import *
 9 from matplotlib.backends.backend_qt4agg import FigureCanvasQTAgg as figureCanvas
10 import matplotlib.pyplot as plt
11 import sys
12
13 class Example1(QWidget):
14     def __init__(self,parent=None):
15         super(Example1,self).__init__(parent)
16
17         figure = plt.gcf() #返回当前的figure
18         self.canvas = figureCanvas(figure)
19         x = [1,2,3]
20         y = [4,5,6]
21         plt.plot(x,y)
22         plt.title(‘Example‘)
23         plt.xlabel(‘x‘)
24         plt.ylabel(‘y‘)
25         self.canvas.draw()
26         layout = QHBoxLayout(self)
27         layout.addWidget(self.canvas)
28
29 class Example2(QWidget):
30     def __init__(self,parent=None):
31         super(Example2,self).__init__(parent)
32
33         figure1 = plt.figure(1) #返回当前的figure
34         x = [1,2,3]
35         y = [4,5,6]
36         plt.plot(x,y)
37         plt.title(‘Example1‘)
38         plt.xlabel(‘x‘)
39         plt.ylabel(‘y‘)
40
41         figure2 = plt.figure(2) #返回当前的figure
42         x = [7,8,9]
43         y = [4,5,6]
44         plt.plot(x,y)
45         plt.title(‘Example2‘)
46         plt.xlabel(‘x‘)
47         plt.ylabel(‘y‘)
48
49         self.canvas1 = figureCanvas(figure1)
50         self.canvas2 = figureCanvas(figure2)
51         self.canvas1.draw()
52         self.canvas2.draw()
53         layout = QHBoxLayout(self)
54         layout.addWidget(self.canvas1)
55         layout.addWidget(self.canvas2)
56
57
58 if __name__ == ‘__main__‘:
59     app = QApplication(sys.argv)
60     ui = Example2()
61     ui.show()
62     app.exec_()
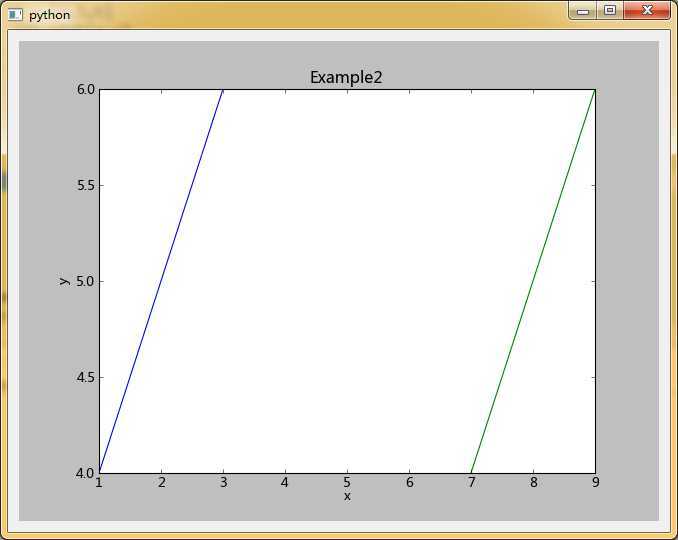
example3:如果想实现在一个figure里画很多线或者图形,很简单,一直绘制就行。

#_*_coding:utf-8_*_
‘‘‘
Created on 2014年12月10日

@author: Administrator
‘‘‘
from PyQt4.QtCore import *
from PyQt4.QtGui import *
from matplotlib.backends.backend_qt4agg import FigureCanvasQTAgg as figureCanvas
import matplotlib.pyplot as plt
import sys

class Example1(QWidget):
    def __init__(self,parent=None):
        super(Example1,self).__init__(parent)

        figure = plt.gcf() #返回当前的figure
        self.canvas = figureCanvas(figure)
        x = [1,2,3]
        y = [4,5,6]
        plt.plot(x,y)
        plt.title(‘Example‘)
        plt.xlabel(‘x‘)
        plt.ylabel(‘y‘)
        self.canvas.draw()
        layout = QHBoxLayout(self)
        layout.addWidget(self.canvas)

class Example2(QWidget):
    def __init__(self,parent=None):
        super(Example2,self).__init__(parent)

        figure1 = plt.figure(1) #返回当前的figure
        x = [1,2,3]
        y = [4,5,6]
        plt.plot(x,y)
        plt.title(‘Example1‘)
        plt.xlabel(‘x‘)
        plt.ylabel(‘y‘)

        figure2 = plt.figure(2) #返回当前的figure
        x = [7,8,9]
        y = [4,5,6]
        plt.plot(x,y)
        plt.title(‘Example2‘)
        plt.xlabel(‘x‘)
        plt.ylabel(‘y‘)

        self.canvas1 = figureCanvas(figure1)
        self.canvas2 = figureCanvas(figure2)
        self.canvas1.draw()
        self.canvas2.draw()
        layout = QHBoxLayout(self)
        layout.addWidget(self.canvas1)
        layout.addWidget(self.canvas2)

class Example3(QWidget):
    def __init__(self,parent=None):
        super(Example3,self).__init__(parent)

#         figure1 = plt.figure(1) #返回当前的figure
        x = [1,2,3]
        y = [4,5,6]
        plt.plot(x,y)
        plt.title(‘Example1‘)
        plt.xlabel(‘x‘)
        plt.ylabel(‘y‘)

#         figure2 = plt.figure(2) #返回当前的figure
        x = [7,8,9]
        y = [4,5,6]
        plt.plot(x,y)
        plt.title(‘Example2‘)
        plt.xlabel(‘x‘)
        plt.ylabel(‘y‘)

        self.canvas1 = figureCanvas(plt.gcf())
#         self.canvas2 = figureCanvas(figure2)
        self.canvas1.draw()
#         self.canvas2.draw()
        layout = QHBoxLayout(self)
        layout.addWidget(self.canvas1)
#         layout.addWidget(self.canvas2)


if __name__ == ‘__main__‘:
    app = QApplication(sys.argv)
    ui = Example3()
    ui.show()
    app.exec_()
example4:这个是一个figure里面多子区的画法,使用subplot()方法,得到的是一个Axes对象,就像是vamei说的有两套方法,plt.add_subplot()还有这种方法,我是比较容易混,一般都是使用前者创建对象,然后使用后面的方式对其属性进行修改。我们这里改了figure的颜色,这些都是artist对象,有很多属性可以修改,后面慢慢上图。

#_*_coding:utf-8_*_
‘‘‘
Created on 2014年12月10日

@author: Administrator
‘‘‘
from PyQt4.QtCore import *
from PyQt4.QtGui import *
from matplotlib.backends.backend_qt4agg import FigureCanvasQTAgg as figureCanvas
import matplotlib.pyplot as plt
import sys

class Example1(QWidget):
    def __init__(self,parent=None):
        super(Example1,self).__init__(parent)

        figure = plt.gcf() #返回当前的figure
        self.canvas = figureCanvas(figure)
        x = [1,2,3]
        y = [4,5,6]
        plt.plot(x,y)
        plt.title(‘Example‘)
        plt.xlabel(‘x‘)
        plt.ylabel(‘y‘)
        self.canvas.draw()
        layout = QHBoxLayout(self)
        layout.addWidget(self.canvas)

class Example2(QWidget):
    def __init__(self,parent=None):
        super(Example2,self).__init__(parent)

        figure1 = plt.figure(1) #返回当前的figure
        x = [1,2,3]
        y = [4,5,6]
        plt.plot(x,y)
        plt.title(‘Example1‘)
        plt.xlabel(‘x‘)
        plt.ylabel(‘y‘)

        figure2 = plt.figure(2) #返回当前的figure
        x = [7,8,9]
        y = [4,5,6]
        plt.plot(x,y)
        plt.title(‘Example2‘)
        plt.xlabel(‘x‘)
        plt.ylabel(‘y‘)

        self.canvas1 = figureCanvas(figure1)
        self.canvas2 = figureCanvas(figure2)
        self.canvas1.draw()
        self.canvas2.draw()
        layout = QHBoxLayout(self)
        layout.addWidget(self.canvas1)
        layout.addWidget(self.canvas2)

class Example3(QWidget):
    def __init__(self,parent=None):
        super(Example3,self).__init__(parent)

        figure = plt.figure(figsize=(10,60),facecolor=‘green‘,edgecolor=‘red‘)
        #figsize = (8,4)表示figure的大小,屏幕显示 640 * 320 , 输出显示 800*400,这个要注意。
        #显示色和外框线条颜色设置。
        self.canvas = figureCanvas(figure)

        plt.subplot(211) # 子区,2行,2列
        x = [1,2,3]
        y = [4,5,6]
        plt.plot(x,y)
        plt.title(‘Example‘)
        plt.xlabel(‘x‘)
        plt.ylabel(‘y‘)

        plt.subplot(223) # 子区,2行,2列
        x = [1,2,3]
        y = [4,5,6]
        plt.bar(x,y)
        plt.title(‘Example‘)
        plt.xlabel(‘x‘)
        plt.ylabel(‘y‘)

        plt.subplot(224) # 子区,2行,2列
        x = [1,2,3]
        y = [4,5,6]
        plt.scatter(x,y)
        plt.title(‘Example‘)
        plt.xlabel(‘x‘)
        plt.ylabel(‘y‘)

        self.canvas.draw()
        layout = QHBoxLayout(self)
        layout.addWidget(self.canvas)


if __name__ == ‘__main__‘:
    app = QApplication(sys.argv)
    ui = Example3()
    ui.show()
    app.exec_()
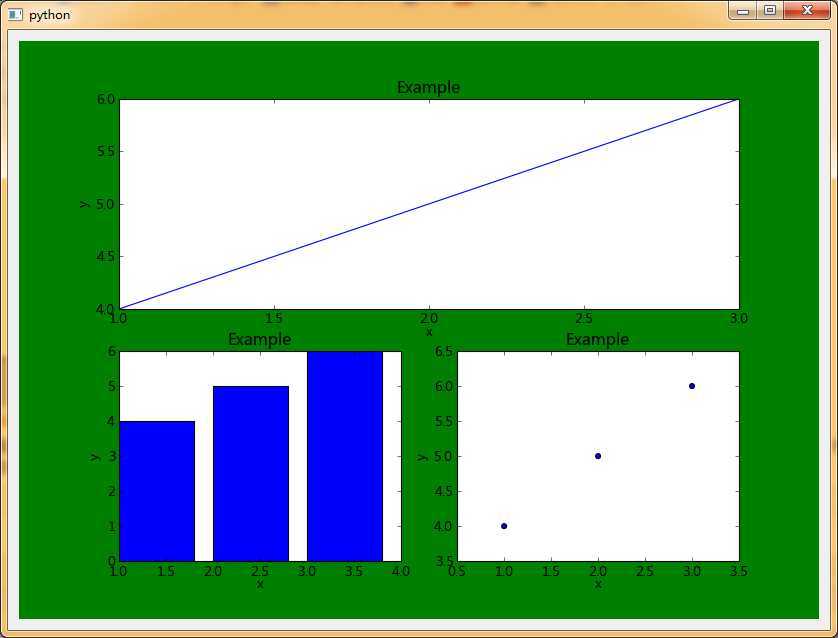
虽然很丑,但是大家可以通过该颜色让它漂亮一点,至于颜色的配置,我只是使用了文本的表示方法,大家可以去查有哪些颜色名称,但是使用过QColor()方法表示颜色是不允许的,因为很少该颜色,所以还没有细看原因。
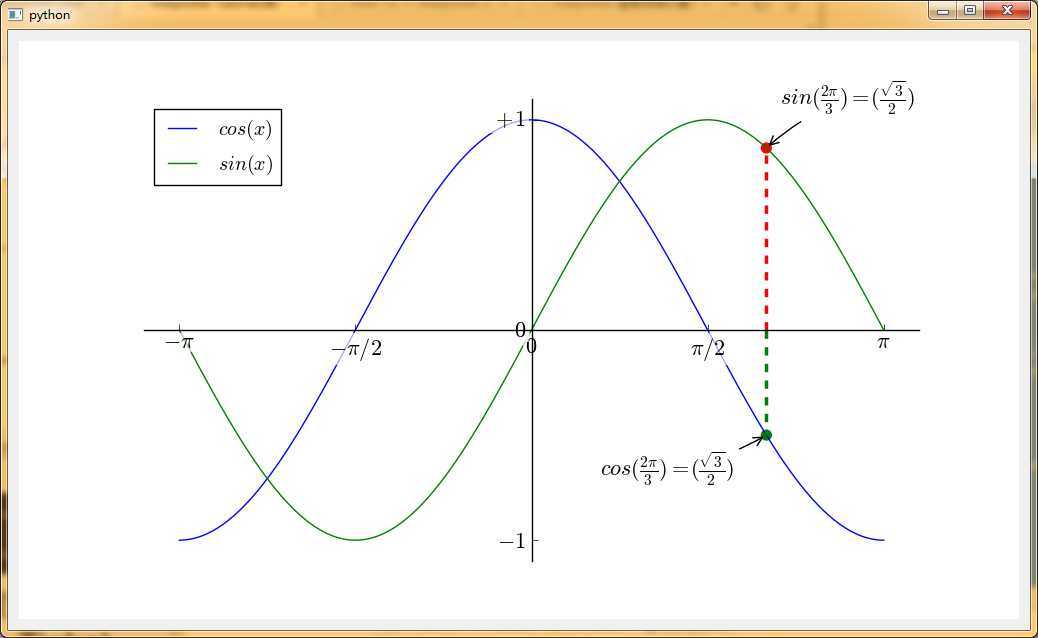
example5:魔鬼在于细节,一个matplotlib指引上的例子。涉及到的几个点,第一是参数的选择,比如color,linewidth,linestyle等,二是spines的应用,例子中用于轴的移动,通过gca()得到axes对象,axes.spines[‘top‘]方法得到上面的轴,axes.spines[‘top‘].set_color(‘none‘),axes.xaxis.set_ticks_position(‘bottom‘),将顶轴上面的刻度移到底轴来,axes.spines[‘bottom‘].set_position((‘data‘,0),再把轴移到0处,同样把左轴移到0处,再使用plt.xticks()方法将轴的刻度自定义。另外使用了annocate方法,注释了数学表达式。最后设置了bbox,先得到axes.get_xticklabels()+axes.get_yticklabels() 得到labels对象,设置字体大小和外框bbox,前色为白色,外框为空,设置透明值。例子来源:http://reverland.org/python/2012/09/07/matplotlib-tutorial/#figure

#_*_coding:utf-8_*_
‘‘‘
Created on 2014年12月10日

@author: Administrator
‘‘‘
from PyQt4.QtCore import *
from PyQt4.QtGui import *
from matplotlib.backends.backend_qt4agg import FigureCanvasQTAgg as figureCanvas
import matplotlib.pyplot as plt
import numpy as np
import sys

class Example1(QWidget):
    def __init__(self,parent=None):
        super(Example1,self).__init__(parent)
        figure = plt.figure(figsize=(10,6),dpi=100,facecolor=‘white‘)
        canvas = figureCanvas(figure)
        x = np.linspace(-np.pi,np.pi,256,endpoint=True)
        c = np.cos(x)
        s = np.sin(x)
        plt.plot(x,c,color=‘blue‘,linewidth=1.0,linestyle=‘-‘,label=‘$cos(x)$‘)#设置颜色,线条的格式和粗细
        plt.plot(x,s,color=‘green‘,linewidth=1.0,linestyle=‘-‘,label=‘$sin(x)$‘)

        ax = plt.gca()
        ax.spines[‘right‘].set_color(‘none‘)
        ax.spines[‘top‘].set_color(‘none‘)
        ax.xaxis.set_ticks_position(‘bottom‘)
        ax.spines[‘bottom‘].set_position((‘data‘,0))
        ax.yaxis.set_ticks_position(‘left‘)
        ax.spines[‘left‘].set_position((‘data‘,0))

        plt.xlim(x.min()*1.1,x.max()*1.1)#X轴的范围
        plt.xticks([-np.pi,-np.pi/2,0,np.pi/2,np.pi],
                   [r‘$-\pi$‘,r‘$-\pi/2$‘,r‘$0$‘,r‘$\pi/2$‘,r‘$\pi$‘])#X轴的刻度值
        plt.ylim(s.min()*1.1,s.max()*1.1)#Y轴的范围
        plt.yticks([-1,0,1],[r‘$-1$‘,r‘$0$‘,r‘$+1$‘]) #设置Y轴的刻度值,第二个参数对其进行格式化

        #添加注释和箭头以及虚线
        t = np.pi *2 / 3
        plt.plot([t,t],[0,np.sin(t)],color=‘red‘,linewidth=2.5,linestyle=‘--‘)
        plt.scatter([t],[np.sin(t)],50,color=‘red‘) #50代表散点的大小,应该是像素值

        plt.plot([t,t],[0,np.cos(t)],color=‘green‘,linewidth=2.5,linestyle=‘--‘)
        plt.scatter([t],[np.cos(t)],50,color=‘green‘)


        plt.annotate(r‘$sin(\frac{2\pi}{3})=(\frac{\sqrt{3}}{2})$‘,
                     xy=(t,np.sin(t)),xycoords=‘data‘,
                     xytext=(10,30),textcoords=‘offset points‘,fontsize=16,
                     arrowprops = dict(arrowstyle=‘->‘,connectionstyle=‘arc3,rad=.1‘))
        plt.annotate(r‘$cos(\frac{2\pi}{3})=(\frac{\sqrt{3}}{2})$‘,
                     xy=(t,np.cos(t)),xycoords=‘data‘,
                     xytext=(-120,-30),textcoords = ‘offset points‘,fontsize=16,
                     arrowprops = dict(arrowstyle=‘->‘,connectionstyle=‘arc3,rad=.1‘)) #后面的参数应该是角度,类似于偏离度,1的时候接近垂直
        plt.legend(loc=‘upper left‘)

        for i in ax.get_xticklabels() + ax.get_yticklabels():
            i.set_fontsize(15)
            i.set_bbox(dict(facecolor=‘white‘,edgecolor=‘none‘,alpha=0.65))

        canvas.draw()
        layout = QHBoxLayout(self)
        layout.addWidget(canvas)

if __name__ == ‘__main__‘:
    app = QApplication(sys.argv)
    ui = Example1()
    ui.show()
    app.exec_()
二、关于figure,subplot,axes,axis和artist对象的理解:
figure更多的是代表当前的一个图像,这个图像在画板上,可以由很多的axes对象组成,使用subplot和axes的区别在于,前值是布局比较规整的,但后者可以放在任何地方,两者都是axes对象,axis是轴对象,我们前面也用过它移动刻度的位置,artist则是一个组成前面各种容器的对象,有很多功能,可以通过它对任意一个对象进行定制。
1. 对figure的布局除了上面的几种方式之外还提供了更强大的功能。
ax1 = plt.subplot2grid((3,3), (0,0), colspan=3)
ax2 = plt.subplot2grid((3,3), (1,0), colspan=2)
ax3 = plt.subplot2grid((3,3), (1, 2), rowspan=2)
ax4 = plt.subplot2grid((3,3), (2, 0))
ax5 = plt.subplot2grid((3,3), (2, 1))
#subplot2grid((3,3),(0,0),colspan=3)3行3列的表格,图形从第一行第一列起,占用3列,rowspan=2指占用两行。

import matplotlib.gridspec as gridspec
gs = gridspec.GridSpec(3, 3)
ax1 = plt.subplot(gs[0, :])
ax2 = plt.subplot(gs[1,:-1])
ax3 = plt.subplot(gs[1:, -1])
ax4 = plt.subplot(gs[-1,0])
ax5 = plt.subplot(gs[-1,-2])
#使用gridspec定制,还可以使用切片

gs1 = gridspec.GridSpec(3, 3)
gs1.update(left=0.05, right=0.48, wspace=0.05)
ax1 = plt.subplot(gs1[:-1, :])
ax2 = plt.subplot(gs1[-1, :-1])
ax3 = plt.subplot(gs1[-1, -1])

gs2 = gridspec.GridSpec(3, 3)
gs2.update(left=0.55, right=0.98, hspace=0.05)
ax4 = plt.subplot(gs2[:, :-1])
ax5 = plt.subplot(gs2[:-1, -1])
ax6 = plt.subplot(gs2[-1, -1])
#使用update函数指定上下左右和中间子图的间隔

gs = gridspec.GridSpec(2, 2,
                       width_ratios=[1,2],
                       height_ratios=[4,1]
                       )

ax1 = plt.subplot(gs[0])
ax2 = plt.subplot(gs[1])
ax3 = plt.subplot(gs[2])
ax4 = plt.subplot(gs[3])


#设置各子图的比例值
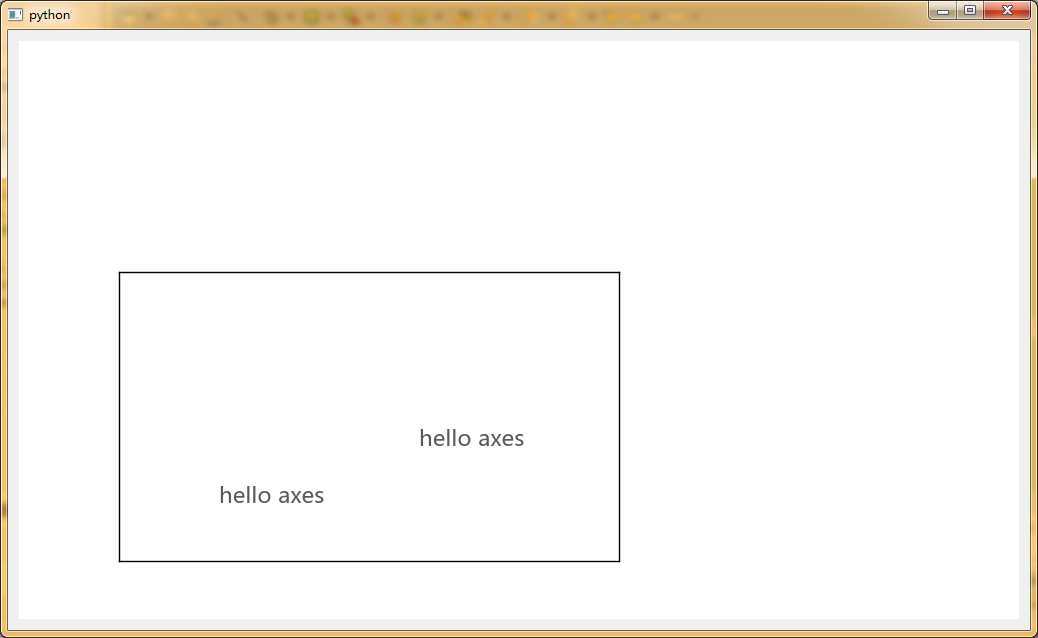
2.axes对象的功能在于可以随意定义地址。还可以使用plt.text()定义一个文本

#_*_coding:utf-8_*_
‘‘‘
Created on 2014年12月10日

@author: Administrator
‘‘‘
#_*_coding:utf-8_*_
‘‘‘
Created on 2014年12月10日

@author: Administrator
‘‘‘
from PyQt4.QtCore import *
from PyQt4.QtGui import *
from matplotlib.backends.backend_qt4agg import FigureCanvasQTAgg as figureCanvas
import matplotlib.pyplot as plt
import numpy as np
import sys

class Example1(QWidget):
    def __init__(self,parent=None):
        super(Example1,self).__init__(parent)
        figure = plt.figure(figsize=(10,6),dpi=100,facecolor=‘white‘)
        canvas = figureCanvas(figure)

        plt.axes([0.1,0.1,0.5,0.5])
        plt.xticks([])
        plt.yticks([])
        plt.text(0.2,0.2,‘hello axes‘,alpha=‘0.65‘,size=16)

        plt.text(0.6,0.4,‘hello axes‘,alpha=‘0.65‘,size=16)

        canvas.draw()
        layout = QHBoxLayout(self)
        layout.addWidget(canvas)

if __name__ == ‘__main__‘:
    app = QApplication(sys.argv)
    ui = Example1()
    ui.show()
    app.exec_()
3. ticks
ax.set_xlim(0,4)
ax.set_ylim(0,3)
ax.xaxis.set_major_locator(MultipleLocator(1.0))
ax.xaxis.set_minor_locator(MultipleLocator(0.1))
ax.yaxis.set_major_locator(MultipleLocator(1.0))
ax.yaxis.set_minor_locator(MultipleLocator(0.1))
ax.grid(which=‘major‘, axis=‘x‘, linewidth=0.75, linestyle=‘-‘, color=‘0.75‘)
ax.grid(which=‘minor‘, axis=‘x‘, linewidth=0.25, linestyle=‘-‘, color=‘0.75‘)
ax.grid(which=‘major‘, axis=‘y‘, linewidth=0.75, linestyle=‘-‘, color=‘0.75‘)
ax.grid(which=‘minor‘, axis=‘y‘, linewidth=0.25, linestyle=‘-‘, color=‘0.75‘)
ax.set_xticklabels([])
ax.set_yticklabels([])

#设置了主定位器和副定位器,并为刻度划线
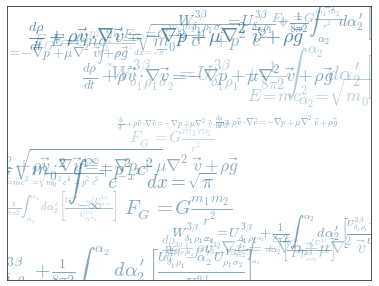
#挺有意思的一个文本显示的图片,可以自定义内容,网上有一些叫做词云可视化的东东就是用很多字组成一个图片的大致轮廓。如果我们分析一张图片,分析出其大致的轮廓然后在相应的像素点用axes代替是不是也可以做出来相应的效果?图像轮廓提取方法研究?
from pylab import *

eqs = []
eqs.append((r"$W^{3\beta}_{\delta_1 \rho_1 \sigma_2} = U^{3\beta}_{\delta_1 \rho_1} + \frac{1}{8 \pi 2} \int^{\alpha_2}_{\alpha_2} d \alpha^\prime_2 \left[\frac{ U^{2\beta}_{\delta_1 \rho_1} - \alpha^\prime_2U^{1\beta}_{\rho_1 \sigma_2} }{U^{0\beta}_{\rho_1 \sigma_2}}\right]$"))
eqs.append((r"$\frac{d\rho}{d t} + \rho \vec{v}\cdot\nabla\vec{v} = -\nabla p + \mu\nabla^2 \vec{v} + \rho \vec{g}$"))
eqs.append((r"$\int_{-\infty}^\infty e^{-x^2}dx=\sqrt{\pi}$"))
eqs.append((r"$E = mc^2 = \sqrt{{m_0}^2c^4 + p^2c^2}$"))
eqs.append((r"$F_G = G\frac{m_1m_2}{r^2}$"))


axes([0.025,0.025,0.95,0.95])

for i in range(24):
    index = np.random.randint(0,len(eqs))
    eq = eqs[index]
    size = np.random.uniform(12,32)
    x,y = np.random.uniform(0,1,2)
    alpha = np.random.uniform(0.25,.75)
    text(x, y, eq, ha=‘center‘, va=‘center‘, color="#11557c", alpha=alpha,
         transform=gca().transAxes, fontsize=size, clip_on=True)
xticks([]), yticks([])
# savefig(‘../figures/text_ex.png‘,dpi=48)
show()
三、其他一些内容,主要是关于属性配置的。详情见博客 http://myshare.dscloud.me/scipydoc/matplotlib_intro.html#figure
lines = plt.plot(x,cos(x),x,sin(x)) # 划了两条直线
plt.setp(lines,color=‘red‘,linwidth=‘2‘) #为多条直线设置了多个属性
lines[0].get_linewidth()使用get_属性 这样的方法来获得某一个属性值,
或plt.getp(lines[1],‘color‘),
plt.getp(lines[0])则返回这个对象的所有的值。
可以使用plt.getp(axes,属性)这样的方法得到相对应的属性值,然后直接通过axes对象使用get或set方法进行属性的配置。
之前提到过使用plt.subplot(221,axisbg=color),不仅可以进行布局,而且还可以直接指定每个子图的背景颜色,figure的颜色在定义中使用facecolor=‘color‘.
下面大部分是直接复制的上面博客链接的内容,感谢作者的辛勤付出。
FigureCanvas和Renderer需要處理底層的繪圖操作,例如使用wxPython在界面上繪圖,或者使用PostScript繪製PDF。Artist則處理所有的高層結構,例如處理圖表、文字和曲線等的繪製和佈局。通常我們只和Artist打交道,而不需要關心底層的繪製細節。
Artists分為簡單類型和容器類型兩種。簡單類型的Artists為標準的繪圖元件,例如Line2D、 Rectangle、 Text、AxesImage 等等。而容器類型則可以包含許多簡單類型的Artists,使它們組織成一個整體,例如Axis、 Axes、Figure等。
直接使用Artists創建圖表的標準流程如下:
>>> import matplotlib.pyplot as plt
>>> fig = plt.figure()
>>> ax = fig.add_axes([0.15, 0.1, 0.7, 0.3])
>>> line, = ax.plot([1,2,3],[1,2,1]) #这里返回的是一个包含一个line2D对象的列表,可以这样写,也可以直接list[0]
>>> ax.lines  #ax的属性lines,包含了所有的line2D对象,下面可以看到他们的id是一样的。如果删除某条直线,那么直接在里面删除即可,其他的属性有的也可以这么使用。
[<matplotlib.lines.Line2D object at 0x0637A3D0>]
>>> line
<matplotlib.lines.Line2D object at 0x0637A3D0>
下面列出axes对象的属性:plt.getp(plt.gca()),里面的属性有多种使用方法:
plt.xlabel() ,axes.set_xlabel(‘‘), axes.xaxis.set_label_text(‘‘), axes.xaxis.label.set_test(‘‘)
这就是从高层到底层的方法。
adjustable = box
agg_filter = None
alpha = None #透明
anchor = C
animated = False #动画
aspect = auto
autoscale_on = True
autoscalex_on = True
autoscaley_on = True
axes = Axes(0.1,0.1;0.5x0.5)
axes_locator = None 子图的定位器
axis_bgcolor = w 子图的背景颜色,
axisbelow = False
children = [<matplotlib.axis.XAxis object at 0x03796990>, <ma...
clip_box = None
clip_on = True
clip_path = None
contains = None
cursor_props = (1, (0.0, 0.0, 0.0, 1.0))
data_ratio = 1.0
data_ratio_log = 0.369070246429
default_bbox_extra_artists = []
figure = Figure(1000x600) 它的figure对象
frame = Rectangle(0,0;1x1)
frame_on = True
gid = None
images = <a list of 0 AxesImage objects>
label =
legend = None 图例
legend_handles_labels = ([], [])
lines = <a list of 1 Line2D objects> line2D列表
navigate = True
navigate_mode = None
picker = None
position = Bbox(‘array([[ 0.1, 0.1],\n [ 0.6, 0.6]])‘...
rasterization_zorder = None
rasterized = None
renderer_cache = None
shared_x_axes = <matplotlib.cbook.Grouper object at 0x036BD610>
shared_y_axes = <matplotlib.cbook.Grouper object at 0x036C70F0>
snap = None
title = 标题
transform = IdentityTransform()
transformed_clip_path_and_affine = (None, None)
url = None
visible = True 是否可见
window_extent = TransformedBbox(Bbox(‘array([[ 0.1, 0.1],\n ...
xaxis = XAxis(100.000000,60.000000)
xaxis_transform = BlendedGenericTransform(CompositeGenericTransform(...
xbound = (1.0, 3.0)
xgridlines = <a list of 5 Line2D xgridline objects>
xlabel = #使用set_xlabel(‘‘)设置坐标轴标签,也可以使用xaxis.set_label_text(‘’)这个是使用的axis对象的方法
xlim = (1.0, 3.0) 限制
xmajorticklabels = <a list of 5 Text xticklabel objects>
xminorticklabels = <a list of 0 Text xticklabel objects>
xscale = linear
xticklabels = <a list of 5 Text xticklabel objects>
xticklines = <a list of 10 Text xtickline objects>
xticks = [ 1. 1.5 2. 2.5 3. ]
yaxis = YAxis(100.000000,60.000000)
yaxis_transform = BlendedGenericTransform(BboxTransformTo(Transforme...
ybound = (4.0, 6.0)
ygridlines = <a list of 5 Line2D ygridline objects>
ylabel =
ylim = (4.0, 6.0)
ymajorticklabels = <a list of 5 Text yticklabel objects>
yminorticklabels = <a list of 0 Text yticklabel objects>
yscale = linear
yticklabels = <a list of 5 Text yticklabel objects>
yticklines = <a list of 10 Line2D ytickline objects>
yticks = [ 4. 4.5 5. 5.5 6. ]
zorder = 0
圖表中的每個元素都用一個matplotlib的Artist對像表示,而每個Artist對象都有一大堆屬性控制其顯示效果。例如Figure對像和Axes對象都有patch屬性作為其背景,它的值是一個Rectangle對象。通過設置此它的一些屬性可以修改Figrue圖表的背景顏色或者透明度等屬性,下面的例子將圖表的背景顏色設置為綠色:
>>> fig = plt.figure()
>>> fig.show()
>>> fig.patch.set_color("g")
>>> fig.canvas.draw()
下面是Artist對象都具有的一些屬性:
Artist對象的所有屬性都通過相應的 get_* 和 set_* 函數進行讀寫,例如下面的語句將alpha屬性設置為當前值的一半:
>>> fig.set_alpha(0.5*fig.get_alpha())
如果你想用一條語句設置多個屬性的話,可以使用set函數:
>>> fig.set(alpha=0.5, zorder=2)
最大的Artist容器是matplotlib.figure.Figure,它包括組成圖表的所有元素。圖表的背景是一個Rectangle對象,用Figure.patch屬性表示。當你通過調用add_subplot或者add_axes方法往圖表中添加軸(子圖時),這些子圖都將添加到Figure.axes屬性中,同時這兩個方法也返回添加進axes屬性的對象,注意返回值的類型有所不同,實際上AxesSubplot是Axes的子類。
為了支持pylab中的gca()等函數,Figure對像內部保存有當前軸的信息,因此不建議直接對Figure.axes屬性進行列表操作,而應該使用add_subplot, add_axes, delaxes等方法進行添加和刪除操作。但是使用for循環對axes中的每個元素進行操作是沒有問題的,下面的語句打開所有子圖的柵格。>>> for ax in fig.axes: ax.grid(True)
figure提供了一些简单的artist对象,主要还是通过里面的axes对象来实现功能的扩展。因为很多情况下都会默认创建一个subplot和axes对象,当然也可以直接操作,比如:
>>> from matplotlib.lines import Line2D
>>> fig = plt.figure()
>>> line1 = Line2D([0,1],[0,1], transform=fig.transFigure, figure=fig, color="r")
>>> line2 = Line2D([0,1],[1,0], transform=fig.transFigure, figure=fig, color="g")
>>> fig.lines.extend([line1, line2])
>>> fig.show()
Figure對像有如下屬性包含其它的Artist對像,也就意味着可以通过他们再进行进一步的操作。
Axes容器是整個matplotlib庫的核心,它包含了組成圖表的眾多Artist對象,並且有許多方法函數幫助我們創建、修改這些對象。和Figure一樣,它有一個patch屬性作為背景,當它是笛卡爾坐標時,patch屬性是一個Rectangle對象,而當它是極坐標時,patch屬性則是Circle對象。例如下面的語句設置Axes對象的背景顏色為綠色:
>>> fig = plt.figure()
>>> ax = fig.add_subplot(111)
>>> ax.patch.set_facecolor("green")
下面詳細列出Axes包含各種Artist對象的屬性:
下面列出Axes的創建Artist對象的方法:
| Axes的方法 | 所創建的對象 | 添加進的列表 |
| annotate | Annotate | texts |
| bars | Rectangle | patches |
| errorbar | Line2D, Rectangle | lines,patches |
| fill | Polygon | patches |
| hist | Rectangle | patches |
| imshow | AxesImage | images |
| legend | Legend | legends |
| plot | Line2D | lines |
| scatter | PolygonCollection | Collections |
| text | Text | texts |
Axis容器包括坐標軸上的刻度線、刻度文本、坐標網格以及坐標軸標題等內容。刻度包括主刻度和副刻度,分別通過Axis.get_major_ticks和Axis.get_minor_ticks方法獲得。每個刻度線都是一個XTick或者YTick對象,它包括實際的刻度線和刻度文本。為了方便訪問刻度線和文本,Axis對像提供了get_ticklabels和get_ticklines方法分別直接獲得刻度文本和刻度线:
>>> pl.plot([1,2,3],[4,5,6])
[<matplotlib.lines.Line2D object at 0x0AD3B670>]
>>> pl.show()
>>> axis = pl.gca().xaxis
>>> axis.get_ticklocs() # 獲得刻度的位置列表
array([ 1. ,  1.5,  2. ,  2.5,  3. ])
>>> axis.get_ticklabels() # 獲得刻度標籤列表
<a list of 5 Text major ticklabel objects>
>>> [x.get_text() for x in axis.get_ticklabels()] # 獲得刻度的文本字符串
[u‘1.0‘, u‘1.5‘, u‘2.0‘, u‘2.5‘, u‘3.0‘]
>>> axis.get_ticklines() # 獲得主刻度線列表,圖的上下刻度線共10條
<a list of 10 Line2D ticklines objects>
>>> axis.get_ticklines(minor=True) # 獲得副刻度線列表,major是主刻度线
<a list of 0 Line2D ticklines objects>
獲得刻度線或者刻度標籤之後,可以設置其各種屬性,下面設置刻度線為綠色粗線,文本為紅色並且旋轉45度:这些方法及其有用
>>> for label in axis.get_ticklabels():
...     label.set_color("red")
...     label.set_rotation(45)
...     label.set_fontsize(16)
...
>>> for line in axis.get_ticklines():
...     line.set_color("green")
...     line.set_markersize(25)
...     line.set_markeredgewidth(3)
上面的例子中,獲得的副刻度線列表為空,這是因為用於計算副刻度的對象缺省為NullLocator,它不產生任何刻度線;而計算主刻度的對象為AutoLocator,它會根據當前的縮放等配置自動計算刻度的位置:
>>> axis.get_minor_locator() # 計算副刻度的對象
<matplotlib.ticker.NullLocator instance at 0x0A014300>
>>> axis.get_major_locator() # 計算主刻度的對象
<matplotlib.ticker.AutoLocator instance at 0x09281B20>
我們可以使用程序為Axis對像設置不同的Locator對象,用來手工設置刻度的位置;設置Formatter對像用來控制刻度文本的顯示。下面的程序設置X軸的主刻度為pi/4,副刻度為pi/20,並且主刻度上的文本以pi為單位:
# -*- coding: utf-8 -*-
import matplotlib.pyplot as pl
from matplotlib.ticker import MultipleLocator, FuncFormatter
import numpy as np
x = np.arange(0, 4*np.pi, 0.01)
y = np.sin(x)
pl.figure(figsize=(8,4))
pl.plot(x, y)
ax = pl.gca()

def pi_formatter(x, pos):
    """
    比較囉嗦地將數值轉換為以pi/4為單位的刻度文本
    """
    m = np.round(x / (np.pi/4))
    n = 4
    if m%2==0: m, n = m/2, n/2
    if m%2==0: m, n = m/2, n/2
    if m == 0:
        return "0"
    if m == 1 and n == 1:
        return "$\pi$"
    if n == 1:
        return r"$%d \pi$" % m
    if m == 1:
        return r"$\frac{\pi}{%d}$" % n
    return r"$\frac{%d \pi}{%d}$" % (m,n)

# 設置兩個坐標軸的範圍
pl.ylim(-1.5,1.5)
pl.xlim(0, np.max(x))

# 設置圖的底邊距
pl.subplots_adjust(bottom = 0.15)

pl.grid() #開啟網格

# 主刻度為pi/4
ax.xaxis.set_major_locator( MultipleLocator(np.pi/4) )

# 主刻度文本用pi_formatter函數計算
ax.xaxis.set_major_formatter( FuncFormatter( pi_formatter ) )

# 副刻度為pi/20
ax