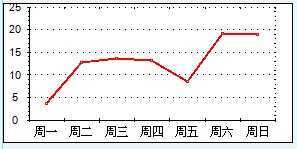
/// <summary> /// 曲线图. /// </summary> public void CreateLineChart(GraphPane myPane, IDictionary<int, int> dic, string title, string xField, string yFields, string format) { myPane.XAxis.Scale.FontSpec.Size = 30;//设置x轴的文字大小. myPane.YAxis.Scale.FontSpec.Size = 30;//设置y轴的文字大小. myPane.YAxis.MajorGrid.IsVisible = true;//设置虚线. myPane.Chart.Border.IsVisible = false;//图表区域的边框设置. myPane.Legend.IsVisible = false;//图表的注释标签显示设置项目. int rows = dic.Count; double[] arrY = new double[rows]; double[] arrX = new double[rows]; string[] labels = new string[rows];
int i = 0; foreach (KeyValuePair<int, int> kvp in dic) { arrX[i] = Convert.ToDouble(kvp.Key); arrY[i] = Convert.ToDouble(kvp.Value); labels[i] = kvp.Key.ToString(); i++; }
LineItem myCurve = myPane.AddCurve(title, arrX, arrY, Color.Red, SymbolType.Square); myCurve.Symbol.Fill = new Fill(Color.Blue, Color.White, Color.Blue);//填充这个蓝条,让这蓝条看起来有3D的效果 myCurve.Line.Width = 2;
myPane.XAxis.Scale.TextLabels = labels; //X轴的说明文字 myPane.XAxis.Type = AxisType.Text; }

myPane.XAxis.Scale.FontSpec.Size = 30;//设置x轴的文字大小. myPane.YAxis.Scale.FontSpec.Size = 30;//设置y轴的文字大小. myPane.YAxis.MajorGrid.IsVisible = true;//设置虚线. myPane.Chart.Border.IsVisible = false;//图表区域的边框设置. myPane.Legend.IsVisible = false;//图表的注释标签显示设置项目.
myPane.YAxis.Scale.Min = 0;//设置只显示正半轴. myPane.YAxis.Scale.MajorStep = 1;//设置刻度为1;


