标签:
A Bayes factor (BF) is a statistical index that quantifies the evidence for a hypothesis, compared to an alternative hypothesis (for introductions to Bayes factors, see here, here or here).
Although the BF is a continuous measure of evidence, humans love verbal labels, categories, and benchmarks. Labels give interpretations of the objective index – and that is both the good and the bad about labels. The good thing is that these labels can facilitate communication (but see @richardmorey), and people just crave for verbal interpretations to guide their understanding of those “boring” raw numbers.

The bad thing about labels is that an interpretation should always be context dependent (Such as “30 min.” can be both a long time (train delay) or a short time (concert), as @CaAl said). But once a categorical system has been established, it’s no longer context dependent.
These labels can also be a dangerous tool, as they implicitly introduce cutoff values (“Hey, the BF jumped over the boundary of 3. It’s not anecdotal any more, it’s moderate evidence!”). But we do not want another sacred .05 criterion!; see also Andrew Gelman’s blog post and its critical comments. The strength of the BF is precisely its non-binary nature.
Several labels for paraphrasing the size of a BF have been suggested. The most common system seems to be the suggestion of Harold Jeffreys (1961):
Bayes factor  | Label |
|---|---|
| > 100 | Extreme evidence for H1 |
| 30 – 100 | Very strong evidence for H1 |
| 10 – 30 | Strong evidence for H1 |
| 3 – 10 | Moderate evidence for H1 |
| 1 – 3 | Anecdotal evidence for H1 |
| 1 | No evidence |
| 1/3 – 1 | Anecdotal evidence for H0 |
| 1/3 – 1/10 | Moderate evidence for H0 |
| 1/10 – 1/30 | Strong evidence for H0 |
| 1/30 – 1/100 | Very strong evidence for H0 |
| < 1/100 | Extreme evidence for H0 |
Note: The original label for 3 < BF < 10 was “substantial evidence”. Lee and Wagenmakers (2013) changed it to “moderate”, as “substantial” already sounds too decisive. “Anecdotal” formerly was known as “Barely worth mentioning”.
Kass and Raftery suggested a comparable classification, only that the “strong evidence” category for them starts at BF > 20 (see also Wikipedia entry).
How much is a of 3.7? It indicates that data occured 3.7x more likely under  than under
  , given the priors assumed in the model. Is that a lot of evidence for ? Or not?
Following Table 1, it can be labeled “moderate evidence” for an effect – whatever that means.
Some have argued that strong evidence, such as BFs > 10, are quite evident from eyeballing only:
“If your result needs a statistician then you should design a better experiment.” (attributed to Ernest Rutherford)
If you have to search for the statistically significant, then it’s not. #statistics #ddj#dataviz
— Edward Tufte (@EdwardTufte) 13. Januar 2015
Is that really the case? Can we just “see” it when there is an effect?
Imagine the following scenario: When I give a present to my two boys (4 and 6 years old), it is not so important what it is. The most important thing is: “Is it fair?”. (And my boys are very sensitive detectors of unfairness).
Imagine you have bags with red and blue marbles. Obviously, the blue marbles are much better, so it is key to make sure that in each bag there is an equal number of red and blue marbles. Hence, for our familial harmony I should check whether reds and blues are distributed evenly or not. In statistical terms: : p = 0.5, : p != 0.5.
When drawing samples from the bags, the strongest evidence for an even distribution () is given when exactly the same number of red and blue marbles has been drawn. How much evidence for is it when I draw n=2, 1 red/1 blue? The answer is in Figure 1, upper table, first row: The is 0.86 in favor of , resp. a of 1.16 in favor of – i.e., anecdotal evidence for an equal distribution.
You can get these values easily with the famous BayesFactor package for R:
What if I had drawn two reds instead? Then the BF would be 1.14 in favor of (see Figure 1, lower table, row 1).
Obviously, with small sample sizes it’s not possible to generate strong evidence, neither for nor for . You need a minimal sample size to leave the region of “anecdotal evidence”. Figure 1 shows some examples how the BF gets more extreme with increasing sample size.

Figure 1.
These visualizations indeed seem to indicate that for simple designs such as the urn model you do not really need a statistical test if your BF is > 10. You can just see it from looking at the data (although the “obviousness” is more pronounced for large BFs in small sample sizes).
The dotted lines in Figure 2 show the maximal and the minimal BF that can be obtained for a given number of drawn marbles. The minimum BF is obtained when the sample is maximally consistent with (i.e. when exactly the same number of red and blue marbles has been drawn), the maximal BF is obtained when only marbles from one color are drawn.

Figure 2: Maximal and minimal BF for a certain sample size.
Figure 2 highlights two features:
nor for . than for . This property depends somewhat on the choice of the prior distribution of effect sizes. If you expect very strong effects under the , it is easier to get evidence for . But still, with every reasonable prior distribution, it is easier to gather evidence for .
Here’s a shiny widget that let’s you draw marbles from the urn. Monitor how the BF evolves as you sequentially add marbles to your sample!
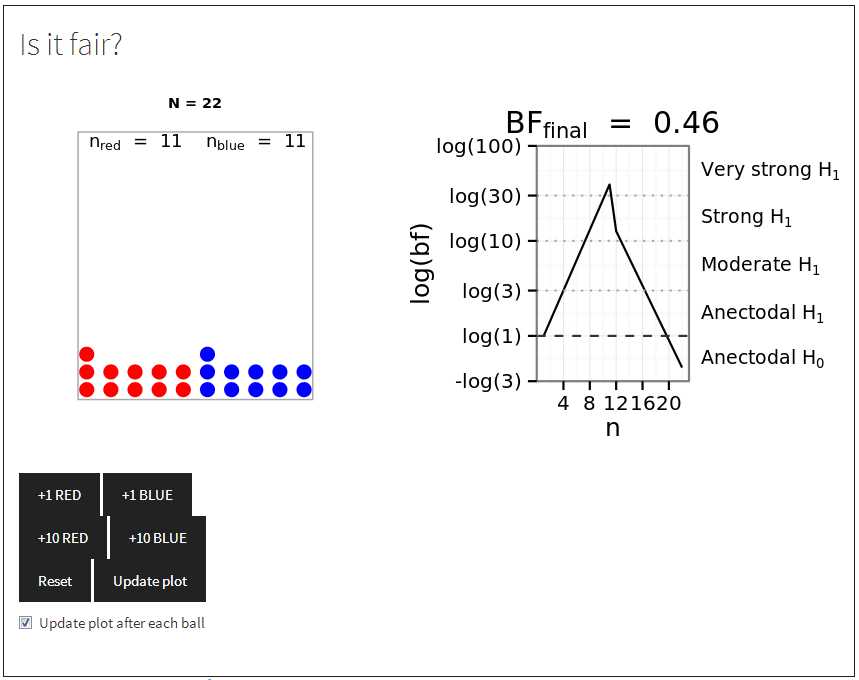

When I teach sequential sampling and Bayes factors, I bring an actual bag with marbles (or candies of two colors).
In my typical setup I ask some volunteers to test whether the same amount of both colors is in the bag. (The bag of course has a cover so that they don’t see the marbles). They may sample as many marbles as they want, but each marble costs them 10 Cent (i.e., an efficiency criterium: Sample as much as necessary, but not too much!). They should think aloud, about when they have a first hunch, and when they are relatively sure about the presence or absence of an effect. I use a color mixture of 2:1 – in my experience this give a good chance to detect the difference, but it’s not too obvious (some teams stop sampling and conclude “no difference”).
This exercise typically reveals following insights (hopefully!)
= 2.7). This might change, however, if in the scenario a wrong decision is associated with higher costs. Next time, I will try a scenario of prescription drugs which have potentially severe side effects.
The analysis so far seems to support the “interocular traumatic test”: “when the data are so compelling that conclusion hits you straight between the eyes” (attributed to Joseph Berkson; quoted from Wagenmakers, Verhagen, & Ly, 2014).
But the authors go on and quote Edwards et al. (1963, p. 217), who said: “…the enthusiast’s interocular trauma may be the skeptic’s random error. A little arithmetic to verify the extent of the trauma can yield great peace of mind for little cost.”.
In the next visualization we will see, that large Bayes factors are not always obvious.
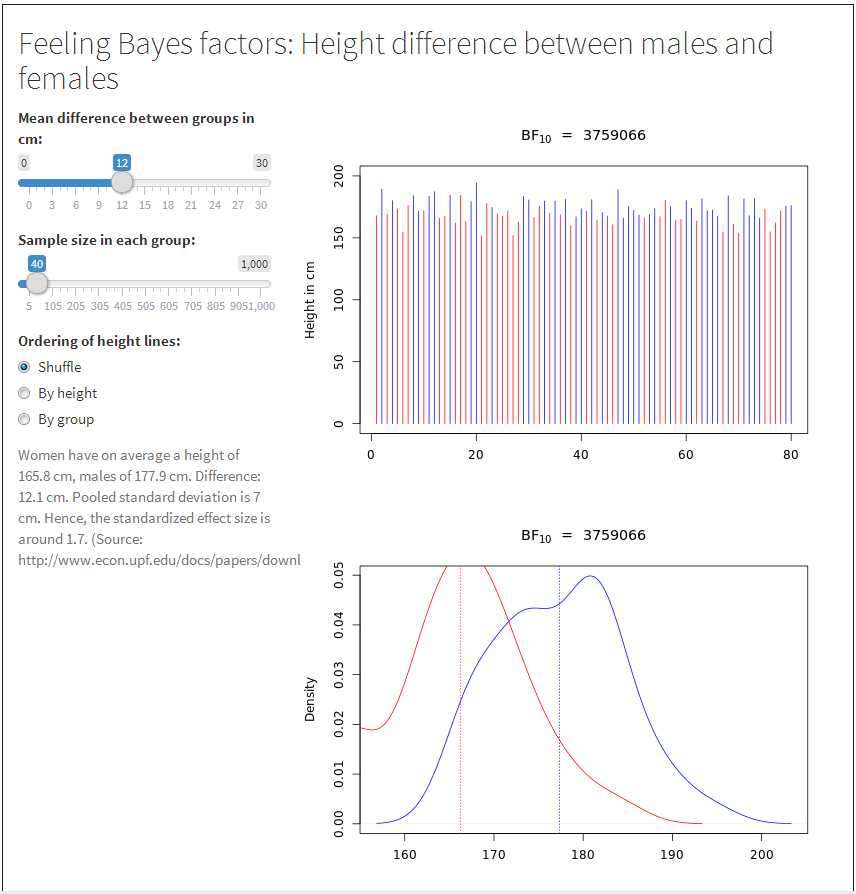
What happens if we switch to group differences? European women have on average a self-reported height of 165.8 cm, European males of 177.9 cm – difference: 12.1 cm, pooled standard deviation is around 7 cm. (Source:European Community Household Panel; see Garcia, J., & Quintana-Domeque, C., 2007; based on ~50,000 participants born between 1970 and 1980). This translates to a Cohen’s d of 1.72.
Unfortunately, this source only contains self-reported heights, which can be subject to biases (males over-report their height on average). But it was the only source I found which also contains the standard deviations within sex. However, Meyer et al (2001) report a similar effect size of d = 1.8 for objectively measured heights.
Now look at this plot. Would you say the blue lines are obviously higher than the red ones?

I couldn’t say for sure. But the is 14.54, a “strong” evidence!
If we sort the lines by height the effect is more visible:

… and alternatively, we can plot the distributions of males’ and females’ heights:
Again, you can play around with the interactive app:
To summarize: Whether a strong evidence “hits you between the eyes” depends on many things – the kind of test, the kind of visualization, the sample size. Sometimes a BF of 2.5 seems obvious, and sometimes it is hard to spot a BF>100 by eyeballing only. Overall, I’m glad that we have a numeric measure of strength of evidence and do not have to rely on eyeballing only.
Try it yourself – draw some marbles in the interactive app, or change the height difference between males and females, and calibrate your personal gut feeling with the resulting Bayes factor!
转自:http://www.nicebread.de/what-does-a-bayes-factor-feel-like/
What does a Bayes factor feel like?(转)
标签:
原文地址:http://www.cnblogs.com/payton/p/4266135.html