标签:
<!DOCTYPE html>
<html>
<head>
<meta http-equiv="Content-Type" content="text/html; charset=utf-8">
<!--The viewport meta tag is used to improve the presentation and behavior of the samples
on iOS devices-->
<meta name="viewport" content="initial-scale=1, maximum-scale=1,user-scalable=no">
<title>Feature Layer - display results as an InfoWindow onHover</title>
<link rel="stylesheet" type="text/css" href="./arcgis_js_api/library/3.12/3.12/dijit/themes/tundra/tundra.css" />
<link rel="stylesheet" type="text/css" href="./arcgis_js_api/library/3.12/3.12/esri/css/esri.css" />
<style>
html, body, #mapDiv {
padding: 0;
margin: 0;
height: 100%;
}
#mapDiv {
position: relative;
}
#info {
background: #fff;
box-shadow: 0 0 5px #888;
left: 1em;
padding: 0.5em;
position: absolute;
bottom: 1em;
z-index: 40;
}
</style>
<script src="./arcgis_js_api/library/3.12/3.12/init.js"></script>
<script src="./arcgis_js_api/library/3.12/3.12/js/dojo/dojo/dojo.js"></script>
<script>
var map, dialog;
// legacy
dojo.require("esri.map");
dojo.require("esri.layers.FeatureLayer");
dojo.require("esri.symbols.SimpleFillSymbol");
dojo.require("esri.symbols.SimpleLineSymbol");
dojo.require("esri.renderers.SimpleRenderer");
dojo.require("esri.graphic");
dojo.require("esri.lang");
dojo.require("esri.Color");
dojo.require("dojo.number");
dojo.require("dojo.dom-style");
dojo.require("dijit.TooltipDialog");
dojo.require("dijit.popup");
dojo.require("dojo.domReady");
function init() {
map = new esri.Map("mapDiv", {
center:[41486975.02495959, 5053546.601156929],
zoom: 8,
slider: true
});
//添加一个图层
var censusMapLayer = new esri.layers.ArcGISDynamicMapServiceLayer("http://192.168.135.250:6080/arcgis/rest/services/CZDJ/CZDJ_ZD/MapServer");
map.addLayer(censusMapLayer);
var baiChengCity = new esri.layers.FeatureLayer("http://192.168.135.250:6080/arcgis/rest/services/CZDJ/CZDJ_ZD/MapServer/2", {
mode: esri.layers.FeatureLayer.MODE_SNAPSHOT, // be careful with the namespace using between AMD with Legacy
outFields: ["QLR", "TDZL", "DJH", "YSDM", "ZDID"]
});
// set define zone
// baiChengCity.setDefinitionExpression("YSDM = ‘2006010100‘");
var symbol = new esri.symbol.SimpleFillSymbol(
esri.symbol.SimpleFillSymbol.STYLE_SOLID,
new esri.symbol.SimpleLineSymbol(
esri.symbol.SimpleLineSymbol.STYLE_SOLID,
new esri.Color([255, 255, 255, 0.35]),
1
),
new esri.Color([125, 125, 125, 0.35])
);
baiChengCity.setRenderer(new esri.renderer.SimpleRenderer(symbol));
map.addLayer(baiChengCity);
// info window
map.infoWindow.resize(245, 125);
dialog = new dijit.TooltipDialog({
id: "tooltipDialog",
style: "position: absolute; width: 250px; font: normal normal normal 10pt Helvetica;z-index:100"
});
dialog.startup();
var highlightSymbol = new esri.symbol.SimpleFillSymbol(
esri.symbol.SimpleFillSymbol.STYLE_SOLID,
new esri.symbol.SimpleLineSymbol(
esri.symbol.SimpleLineSymbol.STYLE_SOLID,
new esri.Color([255, 0, 0]), 3
),
new esri.Color([125, 125, 125, 0.35])
);
//close the dialog when the mouse leaves the highlight graphic
map.on("load", function () {
map.graphics.enableMouseEvents();
map.graphics.on("mouse-out", closeDialog);
});
//listen for when the onMouseOver event fires on the countiesGraphicsLayer
//when fired, create a new graphic with the geometry from the event.graphic and add it to the maps graphics layer
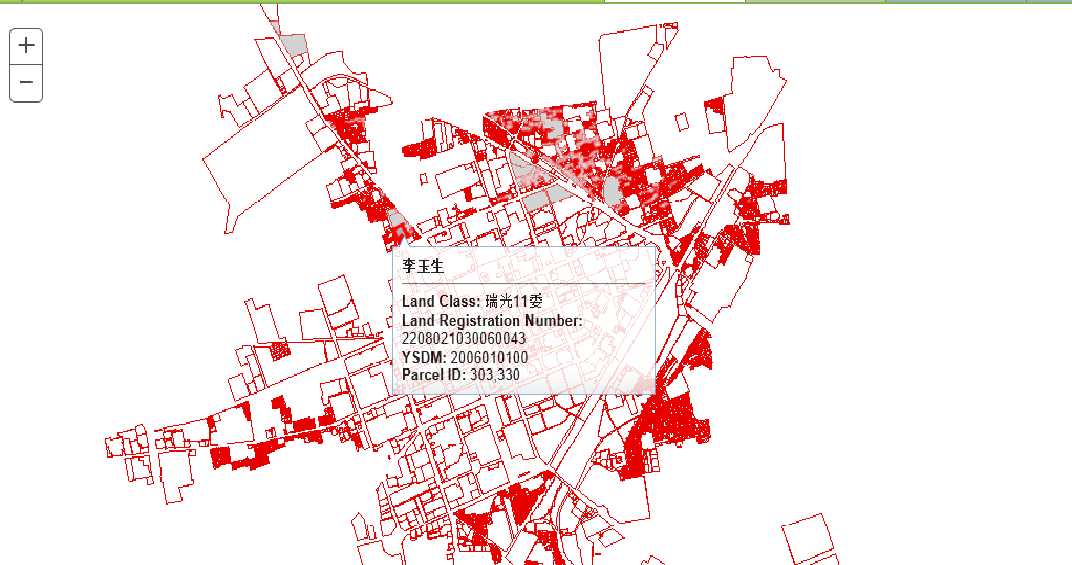
baiChengCity.on("mouse-over", function (evt) {
var t = "<b>${QLR}</b><hr><b>Land Class: </b>${TDZL}<br>"
+ "<b>Land Registration Number: </b>${DJH}<br>"
+ "<b>YSDM: </b>${YSDM}<br>"
+ "<b>Parcel ID: </b>${ZDID:NumberFormat}";
var content = esri.lang.substitute(evt.graphic.attributes, t);
var highlightGraphic = new esri.graphic(evt.graphic.geometry, highlightSymbol);
map.graphics.add(highlightGraphic);
dialog.setContent(content);
dojo[‘dom-style‘].set(dialog.domNode, "opacity", 0.85);
dijit.popup.open({
popup: dialog,
x: evt.pageX,
y: evt.pageY
});
});
//显示坐标
dojo.connect(map, "onLoad", function () {
dojo.connect(map, "onMouseMove", showCoordinates);
dojo.connect(map, "onMouseDrag", showCoordinates);
});
}
function closeDialog()
{
map.graphics.clear();
dijit.popup.close(dialog);
}
function showCoordinates(evt) {
var mp = evt.mapPoint;
dojo.byId("infoXY").innerHTML = "X: " + mp.x + "<br/>" + "Y: " + mp.y;
}
dojo.addOnLoad(init);
/* AMD
require([
"esri/map", "esri/layers/FeatureLayer",
"esri/symbols/SimpleFillSymbol", "esri/symbols/SimpleLineSymbol",
"esri/renderers/SimpleRenderer", "esri/graphic", "esri/lang",
"esri/Color", "dojo/number", "dojo/dom-style",
"dijit/TooltipDialog", "dijit/popup", "dojo/domReady!"
], function (
Map, FeatureLayer,
SimpleFillSymbol, SimpleLineSymbol,
SimpleRenderer, Graphic, esriLang,
Color, number, domStyle,
TooltipDialog, dijitPopup
) {
map = new Map("mapDiv", {
basemap: "streets",
center: [-80.94, 33.646],
zoom: 8,
slider: false
});
var southCarolinaCounties = new FeatureLayer("http://sampleserver1.arcgisonline.com/ArcGIS/rest/services/Demographics/ESRI_Census_USA/MapServer/3", {
mode: FeatureLayer.MODE_SNAPSHOT,
outFields: ["NAME", "POP2000", "POP2007", "POP00_SQMI", "POP07_SQMI"]
});
southCarolinaCounties.setDefinitionExpression("STATE_NAME = ‘South Carolina‘");
var symbol = new SimpleFillSymbol(
SimpleFillSymbol.STYLE_SOLID,
new SimpleLineSymbol(
SimpleLineSymbol.STYLE_SOLID,
new Color([255, 255, 255, 0.35]),
1
),
new Color([125, 125, 125, 0.35])
);
southCarolinaCounties.setRenderer(new SimpleRenderer(symbol));
map.addLayer(southCarolinaCounties);
map.infoWindow.resize(245, 125);
dialog = new TooltipDialog({
id: "tooltipDialog",
style: "position: absolute; width: 250px; font: normal normal normal 10pt Helvetica;z-index:100"
});
dialog.startup();
var highlightSymbol = new SimpleFillSymbol(
SimpleFillSymbol.STYLE_SOLID,
new SimpleLineSymbol(
SimpleLineSymbol.STYLE_SOLID,
new Color([255, 0, 0]), 3
),
new Color([125, 125, 125, 0.35])
);
//close the dialog when the mouse leaves the highlight graphic
map.on("load", function () {
map.graphics.enableMouseEvents();
map.graphics.on("mouse-out", closeDialog);
});
//listen for when the onMouseOver event fires on the countiesGraphicsLayer
//when fired, create a new graphic with the geometry from the event.graphic and add it to the maps graphics layer
southCarolinaCounties.on("mouse-over", function (evt) {
var t = "<b>${NAME}</b><hr><b>2000 Population: </b>${POP2000:NumberFormat}<br>"
+ "<b>2000 Population per Sq. Mi.: </b>${POP00_SQMI:NumberFormat}<br>"
+ "<b>2007 Population: </b>${POP2007:NumberFormat}<br>"
+ "<b>2007 Population per Sq. Mi.: </b>${POP07_SQMI:NumberFormat}";
var content = esriLang.substitute(evt.graphic.attributes, t);
var highlightGraphic = new Graphic(evt.graphic.geometry, highlightSymbol);
map.graphics.add(highlightGraphic);
dialog.setContent(content);
domStyle.set(dialog.domNode, "opacity", 0.85);
dijitPopup.open({
popup: dialog,
x: evt.pageX,
y: evt.pageY
});
});
function closeDialog() {
map.graphics.clear();
dijitPopup.close(dialog);
}
});*/
</script>
</head>
<body class="tundra">
<div id="mapDiv">
<div id="info">
Hover over a county in BaiCheng City to get more information.
</div>
<div id="infoXY" style="position:absolute; right:25px; bottom:5px; color:#000; z-index:40;"></div>
</div>
</body>
</html>
最近研究了一段时间Arcgis Javascript的 Web 前段开发, 虽然资料很多,但是还是感觉困难重重。
终于今天努力照着示例做出了一个像模像样的地图,虽然功能很简单,但是碰到了本地化js和Legacy的dojo使用方法很多细节问题,需要在以后工作中特别注意。
以后的路还很长,,,, To be continue。。。
标签:
原文地址:http://www.cnblogs.com/liflying/p/4271108.html