标签:
我想大多数人都知道“Echarts” 百度图说,
如果你不知道的话,http://echarts.baidu.com/index.html;点击进入,会让你收获满满的;
这里,我不去再举例说明了,因为,你下载的文档,已经够详细的,这里,我提几点,我在用Echarts时候,遇到小挫折:
1.如何去加载你的后台数据:
我用到两种实现:
一:利用ajax去异步请求你的数据,大家不妨把option里面参数,当作是类的属性;(后面的代码会看到)
二:在后台把你的参数拼成字符串,当然,这里,需要注意参数的格式,我想,你看到demo的时候,你就会很清楚,按照它的样子去拼吧;
2.圆饼图,这是我必须要说的:
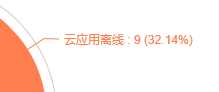
这里加上参数 9(32.14%),都是itemStyle惹得祸;
 series: [
                {
                    name: ‘告警来源‘,
                    type: ‘pie‘,
                    radius: ‘50%‘,
                    center: [‘50%‘, ‘46%‘],
                    data: [
                        { value: [], name: ‘云应用离线‘ },
                    ],
                    //饼图的显示值:(看这里)
                    itemStyle: {
                        normal: {
                            label: {
                                show: true,
                                formatter: ‘{b} : {c} ({d}%)‘
                            },
                            labelLine: { show: true }
                        }
                    }
                }
            ]
颜色的话:
//color: [‘#00448a‘, ‘#0580b9‘, ‘#28c6b9‘, ‘#84e6f1‘, ‘#dddddd‘, ‘#dddddd‘, ‘#dddddd‘, ‘#dddddd‘], //设置颜色
这里,我贴上一段代码,希望对初学者有用:
<script src="../Scripts/Echartsjs/echarts.js"></script>

<script type="text/javascript">
    var ramechart;
    var cpuechart;
    var diskechart;
    //var diskusedechart;
    $(function () {


        load();
});


function load() {
        // Step:3 conifg ECharts‘s path, link to echarts.js from current page.
        // Step:3 为模块加载器配置echarts的路径,从当前页面链接到echarts.js,定义所需图表路径
        require.config({
            paths: {
                echarts: ‘../Scripts/Echartsjs‘
            }
        });

        // Step:4 require echarts and use it in the callback.
        // Step:4 动态加载echarts然后在回调函数中开始使用,注意保持按需加载结构定义图表路径
        require(
            [
                ‘echarts‘,
                //‘echarts/chart/bar‘
                ‘echarts/chart/line‘
                //‘echarts/chart/gauge‘
            ],
            DrawEchart
    );
    }

    function DrawEchart(ec) {
        var vmid = ‘@vmID‘;

        //--- 折柱 ---
        ramechart = ec.init(document.getElementById(‘RamDiv‘));
        cpuechart = ec.init(document.getElementById(‘CpuDiv‘));
        diskechart = ec.init(document.getElementById(‘DiskDiv‘));
        //diskusedechart = ec.init(document.getElementById(‘DiskUsedDiv‘));
        //图表显示提示信息
        ramechart.showLoading({
            text: "图表数据正在努力加载..."
        });
        cpuechart.showLoading({
            text: "图表数据正在努力加载..."
        });
        diskechart.showLoading({
            text: "图表数据正在努力加载..."
        });
        //diskusedechart.showLoading({
        //    text: "图表数据正在努力加载..."
        //});
        //ram图表
        var ramoptions = {
            labels: {
                style: {
                    fontSize: ‘14px‘
                }
            },
            legend: {
                data: []
            },
                toolbox: {
            show: false,
            feature: {
            mark: { show: true },
            dataView: { show: true, readOnly: false },
            magicType: { show: true, type: [‘line‘, ‘bar‘] },
            restore: { show: true },
            saveAsImage: { show: true }
            },
                        },
            tooltip: {
                trigger: ‘axis‘,
                //formatter: ‘{b}<br/>{a0}:{c0}<br/>{a1}:{c1}‘
            },
            grid: {
                x: 55,
                y: 15,
                x2: 25,
                y2: 35
            },
            calculable: true,
            xAxis: [
                {
                    type: ‘category‘,
                    data: [],
                    splitLine: {
                        show: false
                    }//分隔线
                }
            ],
            yAxis: [
                {
                    type: ‘value‘,
                    min: 0,
                    max: 100,
                    //axisLine:
                    splitArea: { show: false },//分隔区域
                    splitNumber:10,
                    //tickInterval: 1 //坐标轴刻度值为1
                    axisLabel: {
                        formatter: ‘{value} %‘
                    }
                }
            ],
            series: [
                            {
                                name: ‘内存使用百分比‘,
                                type: ‘line‘,
                                itemStyle: { normal: { color: ‘#1be09e‘ } },//图形样式,可设置图表内图形的默认样式和强调样式
                                data: []
                            }
            ]
        };


        //cpu
        var cpuoptions = {
            labels: {
                style: {
                    fontSize: ‘14px‘
                }
            },
            legend: {
                data: []
            },
            toolbox: {
                show: false,
                feature: {
                    mark: { show: true },
                    dataView: { show: true, readOnly: false },
                    magicType: { show: true, type: [‘line‘, ‘bar‘] },
                    restore: { show: true },
                    saveAsImage: { show: true }
                },
            },
            tooltip: {
                trigger: ‘axis‘,
                //formatter: ‘{b}<br/>{a0}:{c0}<br/>{a1}:{c1}‘
            },
            grid: {
                x: 55,
                y: 15,
                x2: 25,
                y2: 35
            },
            calculable: true,
            xAxis: [
                {
                    type: ‘category‘,
                    data: [],
                    splitLine: {
                        show: false
                    }//分隔线
                }
            ],
            yAxis: [
                {
                    type: ‘value‘,
                    min: 0,
                    max: 100,
                    //axisLine:
                    splitNumber: 10,
                    splitArea: { show: false },//分隔区域
                    //tickInterval: 1 //坐标轴刻度值为1
                    axisLabel : {
                formatter: ‘{value} %‘
            }
                }
            ],
            series: [
                            {
                                name: ‘处理器使用百分比‘,
                                type: ‘line‘,
                                itemStyle: { normal: { color: ‘#7030a0‘ } },//图形样式,可设置图表内图形的默认样式和强调样式
                                data: []
                            }
            ]
        };

        //disk
        var diskoptions = {
            labels: {
                style: {
                    fontSize: ‘14px‘
                }
            },
            legend: {
                data: []
            },
            toolbox: {
                show: false,
                feature: {
                    mark: { show: true },
                    dataView: { show: true, readOnly: false },
                    magicType: { show: true, type: [‘line‘, ‘bar‘] },
                    restore: { show: true },
                    saveAsImage: { show: true }
                },
            },
            tooltip: {
                trigger: ‘axis‘,
                //formatter: ‘{b}<br/>{a0}:{c0}<br/>{a1}:{c1}‘
            },
            grid: {
                x: 75,
                y: 15,
                x2: 25,
                y2: 35
            },
            calculable: true,
            xAxis: [
                {
                    type: ‘category‘,
                    data: [],
                    splitLine: {
                        show: false
                    }//分隔线
                }
            ],
            yAxis: [
                {
                    type: ‘value‘,
                    min: 0,
                    //max: 5,
                    //axisLine:
                    splitNumber: 10,
                    splitArea: { show: false },//分隔区域
                    //tickInterval: 1 //坐标轴刻度值为1

                }
            ],
            series: [
                            {
                                name: ‘read‘,
                                type: ‘line‘,
                                itemStyle: { normal: { color: ‘#4783ce‘ } },//图形样式,可设置图表内图形的默认样式和强调样式
                                data: []
                            },
                            {
                                name: ‘write‘,
                                type: ‘line‘,
                                itemStyle: { normal: { color: ‘#d29a3c‘ } },
                                data: []
                            }
            ]
        };


        //通过Ajax获取数据
        $.ajax({
            type: "post",
            async: false, //同步执行
            url: "/VirtualMachine/ajaxPerformanceInfo",
            dataType: "json", //返回数据形式为json
            data: { VMId:vmid, rnd: Math.random() },
            success: function (result) {
                if (result) {
                    //将返回的category和series对象赋值给options对象内的category和series
                    //因为xAxis是一个数组 这里需要是xAxis[i]的形式
                    ramoptions.xAxis[0].data = result.xAxis;
                    ramoptions.series[0].data = result.ram;
                    ramechart.hideLoading();
                    ramechart.setOption(ramoptions);

                    cpuoptions.xAxis[0].data = result.xAxis;
                    cpuoptions.series[0].data = result.cpu;
                    cpuechart.hideLoading();
                    cpuechart.setOption(cpuoptions);

                    diskoptions.xAxis[0].data = result.xAxis;
                    diskoptions.series[0].data = result.write;
                    diskoptions.series[1].data = result.read;
                    diskechart.hideLoading();
                    diskechart.setOption(diskoptions);

                    //diskuseroptions.series[0].data[0].value = result.DiskUsed;
                    //diskusedechart.hideLoading();
                    //diskusedechart.setOption(diskuseroptions);

                    $("#rammin").text("最小值" + result.Rammin + "%");
                    $("#rammax").text("最大值" + result.Rammax + "%");
                    $("#ramevg").text("平均值" + result.Ramevg + "%");

                    $("#cpumin").text("最小值" + result.Cpumin + "%");
                    $("#cpumax").text("最大值" + result.Cpumax + "%");
                    $("#cpuevg").text("平均值" + result.Cpuevg + "%");

                }
            },
            error: function (errorMsg) {
                alert("图表请求数据失败啦! ");
            }
        });


    }
标签:
原文地址:http://www.cnblogs.com/zychengzhiit1/p/4279342.html