标签:

因为nagios过于复杂,之前弄zabbix又出现了为知状况。我只是想找个能实时收集数据进行分析的工具,无疑Glances是最好的选择。
另外,我在找工具时,发现了一个比较不错的简易监控工具——linux dashboard。github上有,可以去研究下。
glances的安装非常简单,不仅支持直接在终端上显示数据,还支持在web上显示,除了监视本机的负载,还可以非常轻易地监控指定服务器(前提是装有Glances,并以server模式启动glances)的负载,甚至提供了REST和XML-RPC的编程接口,支持数据保存在CSV,html或InfluxDB和Statsd
网址:http://nicolargo.github.io/glances/
文档(感谢作者提供了如此高质量的文档和程序):http://glances.readthedocs.org/en/latest/glances-doc.html
github上的参考内容(安装手册,API手册之类的):https://github.com/nicolargo/glances
我在自己的ubuntu14.04上安装了它(使用pip):
apt-get install python-pip build-essential python-dev
pip install glances bottle     #如果你的linux上缺少bottle这个模块,会无法在web上显示
可以这样更新:
pip install --upgrade Glances
使用方法:
单机运行:
glances
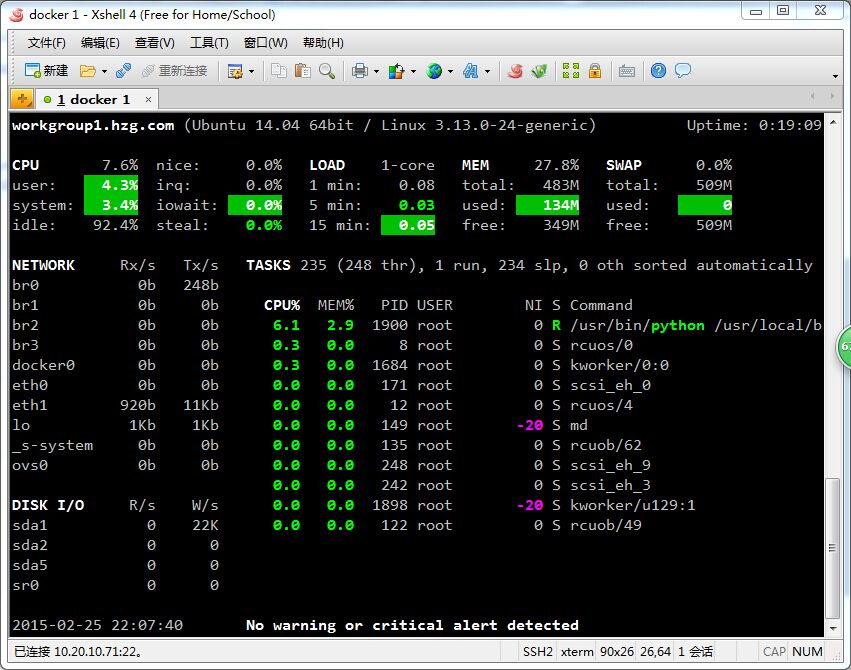
可以按q退出
以web的形式展示:
glances -w

打开自己机器的61208端口:

关于C/S模式,参见:http://glances.readthedocs.org/en/latest/glances-doc.html#client-server-mode
关于编程支持:
先在被监控的服务器上以server模式启动
glances -s
再在另一台带有python的机器上(也可以是本机localhost)编写这个程序:
$ vi test.py
#!/usr/bin/python
import xmlrpclib

s = xmlrpclib.ServerProxy(‘http://10.20.10.71:61209‘)            #注意改为被监控的服务器的IP
print s.getSystem()
执行后:

关于可用的xml-rpc函数,请看:https://github.com/nicolargo/glances/wiki/The-Glances-2.x-API-How-to
作者也提供了一个docker镜像给我们测试:https://github.com/nicolargo/glances/wiki/Install-and-test-Glances-DEVELOP-version
作者另一份详细文档:https://github.com/nicolargo/glances/blob/master/docs/glances-doc.rst
如果你想把数据储存起来供其他服务使用,它支持保存为CSV,html或保存在InfluxDB和Statsd,也可以参考:
https://github.com/nicolargo/glances/blob/master/docs/glances-doc.rst#gateway-to-others-services
总的来说,这个工具非常轻量级,也非常好用,将会被集成到我的个人项目中。
这个项目用的是LGPL协议
参考:
http://www.vpsee.com/2013/07/a-new-system-monitoring-tool-glances-installation-and-usage
https://github.com/nicolargo/glances
标签:
原文地址:http://my.oschina.net/hochikong/blog/379972