标签:
原文链接:caffe.berkeleyvision.org/tutorial/layers.html
创建caffe模型,首先要在protocol buffer 定义文件(prototxt)中定义结构。
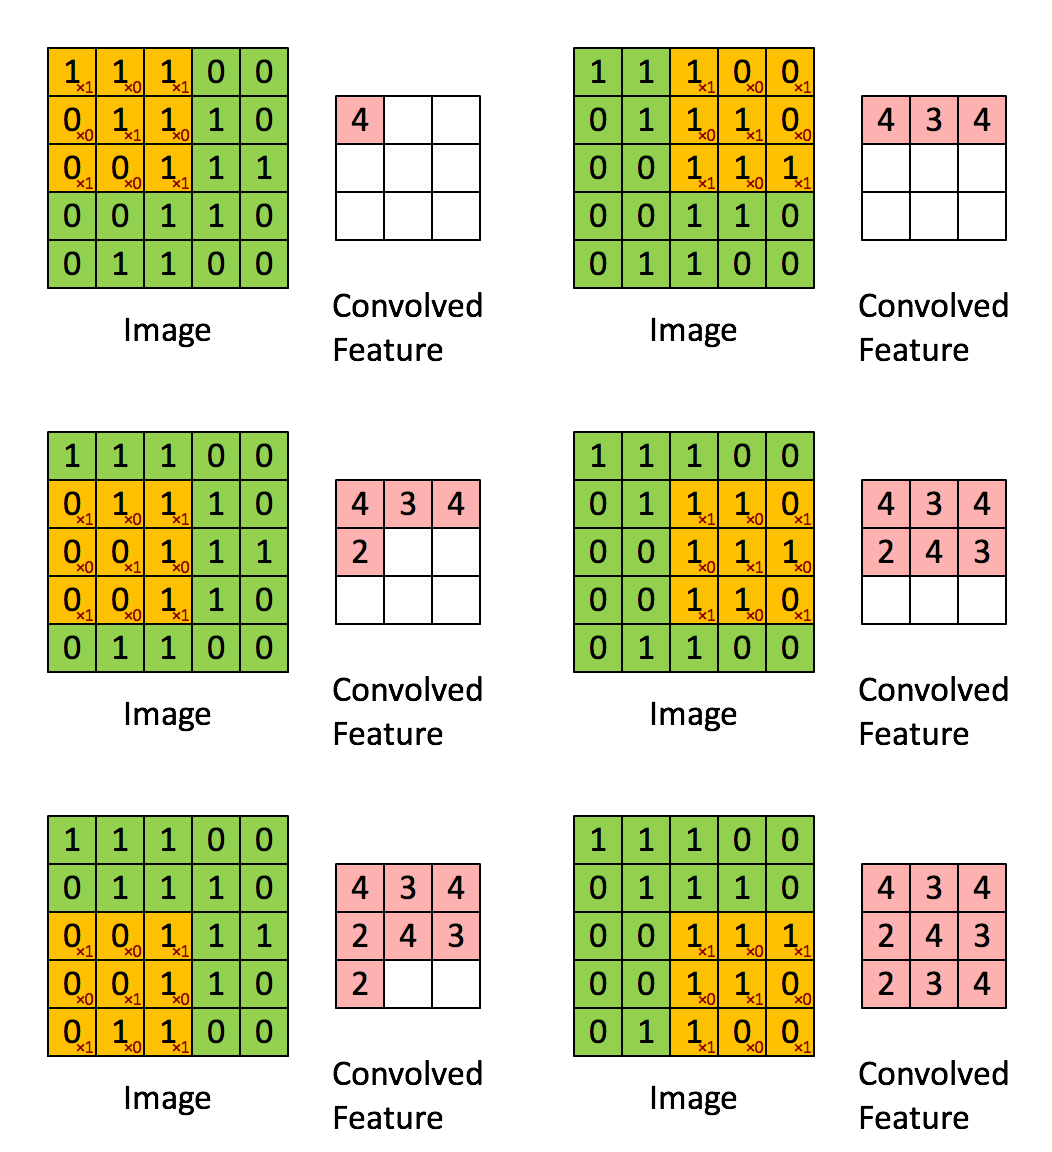
在caffe环境中,图像的明显特征是其空间结构。

Documents:
 1 Parameters (ConvolutionParameter convolution_param)
 2
 3 Required
 4     num_output (c_o): 输出数(filter数)
 5     kernel_size (or kernel_h and kernel_w): 指定卷积核
 6
 7 Strongly Recommended
 8     weight_filler [default type: ‘constant‘ value: 0]
 9
10 Optional
11     bias_term [default true]: 指定是否提供偏置10
12     pad (or pad_h and pad_w) [default 0]: 指定输入图片的两侧像素填充量
13     stride (or stride_h and stride_w) [default 1]: specifies the intervals at which to apply the filters to the input
14     group (g) [default 1]: 如果 g > 1, 我们限制每一个filter之间的连通性 对于输入的子集. 指定输入和输出被分为 g 组,第i输出组只会和第i输入组相连接.
15
16 Input
17
18 n * c_i * h_i * w_i
19
20 Output
21
22 n * c_o * h_o * w_o, where h_o = (h_i + 2 * pad_h - kernel_h) / stride_h + 1 and w_o likewise.
example:
 1 layers {
 2   name: "conv1"
 3   type: CONVOLUTION
 4   bottom: "data"
 5   top: "conv1"
 6   blobs_lr: 1          # learning rate multiplier for the filters
 7   blobs_lr: 2          # learning rate multiplier for the biases
 8   weight_decay: 1      # weight decay multiplier for the filters
 9   weight_decay: 0      # weight decay multiplier for the biases
10   convolution_param {
11     num_output: 96     # learn 96 filters
12     kernel_size: 11    # each filter is 11x11
13     stride: 4          # step 4 pixels between each filter application
14     weight_filler {
15       type: "gaussian" # initialize the filters from a Gaussian
16       std: 0.01        # distribution with stdev 0.01 (default mean: 0)
17     }
18     bias_filler {
19       type: "constant" # initialize the biases to zero (0)
20       value: 0
21     }
22   }
23 }
Pooling:
deeplearning.stanford.edu/wiki/index.php/池化
池化: 概述
在通过卷积获得了特征 (features) 之后,下一步我们希望利用这些特征去做分类。理论上讲,人们可以用所有提取得到的特征去训练分类器,例如 softmax 分类器,但这样做面临计算量的挑战。例如:对于一个 96X96 像素的图像,假设我们已经学习得到了400个定义在8X8输入上的特征,每一个特征和图像卷积都会得到一个 (96 − 8 + 1) * (96 − 8 + 1) = 7921 维的卷积特征,由于有 400 个特征,所以每个样例 (example) 都会得到一个 892 * 400 = 3,168,400 维的卷积特征向量。学习一个拥有超过 3 百万特征输入的分类器十分不便,并且容易出现过拟合 (over-fitting)。
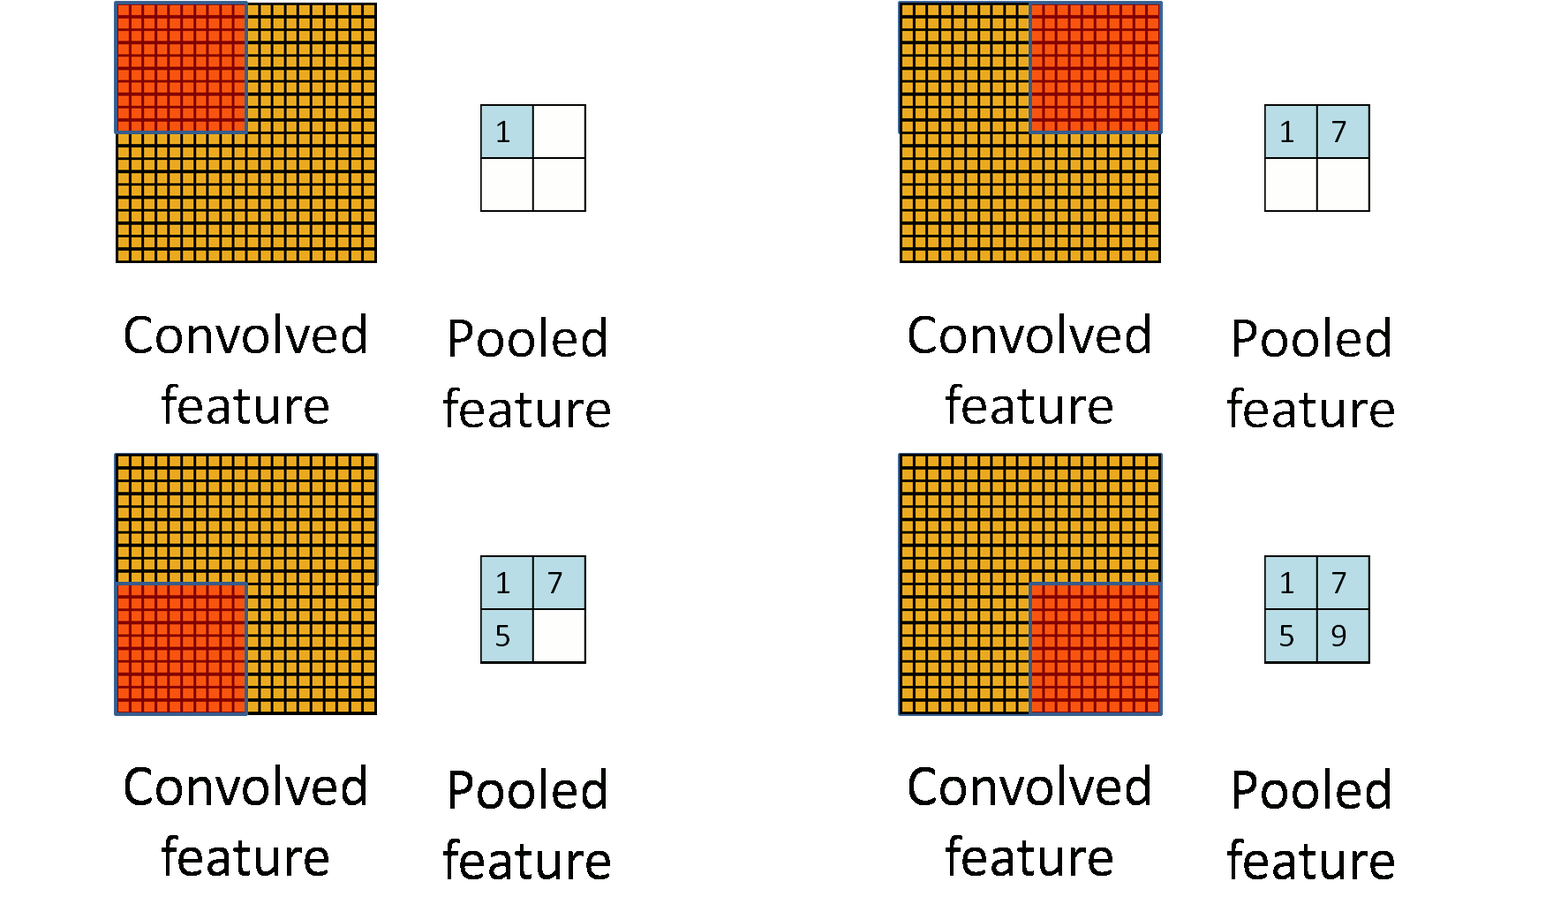
为了解决这个问题,首先回忆一下,我们之所以决定使用卷积后的特征是因为图像具有一种“静态性”的属性,这也就意味着在一个图像区域有用的特征极有可能在 另一个区域同样适用。因此,为了描述大的图像,一个很自然的想法就是对不同位置的特征进行聚合统计,例如,人们可以计算图像一个区域上的某个特定特征的平 均值 (或最大值)。这些概要统计特征不仅具有低得多的维度 (相比使用所有提取得到的特征),同时还会改善结果(不容易过拟合)。这种聚合的操作就叫做池化 (pooling),有时也称为平均池化或者最大池化 (取决于计算池化的方法)。

标签:
原文地址:http://www.cnblogs.com/nwpuxuezha/p/4302024.html