标签:
本节主要解决在一个figure中放置多福图,以及图中一些注释文字的添加等问题。
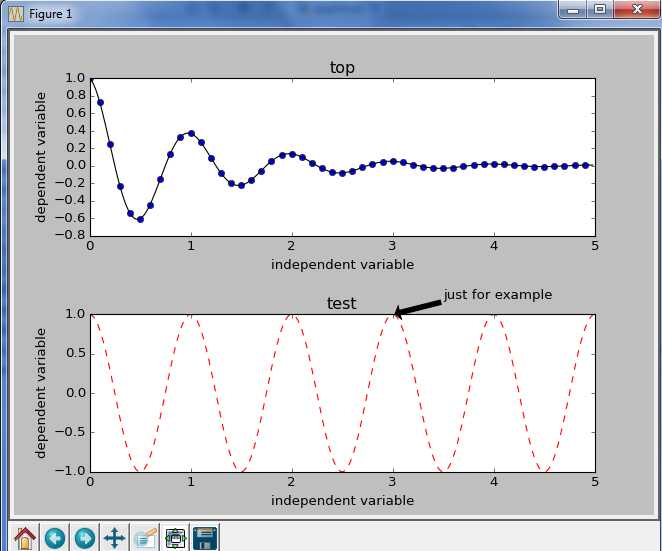
先看一个效果图:
下面是实现代码:
__author__ = ‘hust‘
import numpy as np
import matplotlib.pyplot as plt

def f(t):
    return np.exp(-t) * np.cos(2 * np.pi * t)

t1 = np.arange(0.0, 5.0, 0.1)
t2 = np.arange(0.0, 5.0, 0.02)

plt.figure(1)


plt.subplot(2,1,1)
plt.plot(t1, f(t1), ‘bo‘, t2, f(t2), ‘k‘)
plt.xlabel("independent variable")
plt.ylabel("dependent variable")
plt.title(‘top‘)

plt.subplots_adjust(hspace=.5)

plt.subplot(2,1,2)
plt.plot(t2, np.cos(2 * np.pi * t2), ‘r--‘)
plt.annotate(‘just for example‘, xy = (3.0, np.cos(2 * np.pi * 3.0)),
             xytext = (3.5, np.cos(2 * np.pi * 3.0) * 1.2),arrowprops=dict(facecolor=‘black‘, shrink=0.05)),
plt.xlabel(‘independent variable‘)
plt.ylabel(‘dependent variable‘)
plt.title(‘test‘)

plt.show()
解释一下上面代码中用到的几个函数:
subplot(nrows, ncols, plot_number), nrows和ncols指定将图像分割成nrows * ncols个子图,plot_number标识具体是哪一个子图,
计算方式是从左至右,从上至下。
有时我们看到类似subplot(211)这种,是因为三个参数都不超过10,函数就支持省掉中间的逗号。
subplots_adjust(left=None, bottom=None, right=None, top=None,wspace=None, hspace=None)
我在前面调用的时候使用了关键字参数。这个函数用于设置子图之间的间隙,每个参数的含义很直观,可根据需要使用。
最后说下图中的文字,这个例子,使用了三种:
title, xlabel, ylabel。这三种是比较固定的
还有一种标注性的文字,可以指定标志点(箭头所指的点)和文字的位置,还能指定箭头的风格。
标签:
原文地址:http://www.cnblogs.com/hustxujinkang/p/4432964.html