标签:
matplot 代码实例
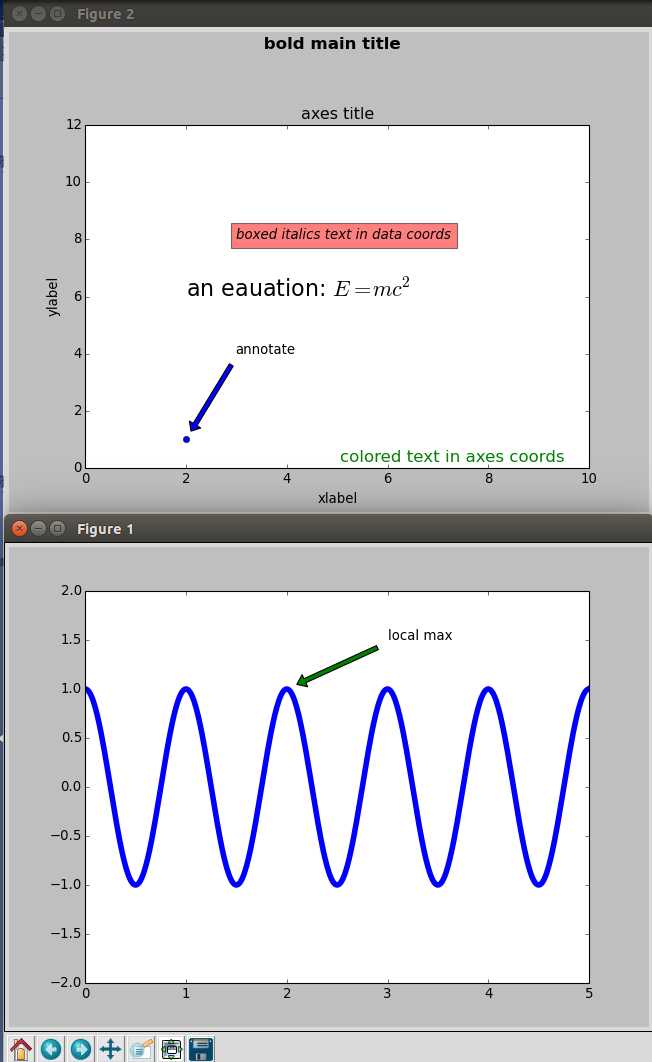
#!/usr/bin/env python
# coding=utf-8

import numpy as np
import matplotlib.pyplot as plt

ax = plt.subplot(111)
t = np.arange(0,5,0.01)
s = np.cos(2*np.pi*t)
line = plt.plot(t,s,lw=5)
plt.annotate(‘local max‘,xy=(2,1),xytext=(3,1.5),arrowprops=dict(facecolor=‘green‘,shrink=0.1))
plt.ylim(-2,2)
#plt.show()


##########
fig = plt.figure()
fig.suptitle(‘ bold main title ‘,fontsize=15,fontweight=‘bold‘)
ax = fig.add_subplot(111)
fig.subplots_adjust(top=0.8)
ax.set_title("axes title")
ax.set_xlabel("xlabel")
ax.set_ylabel("ylabel")
ax.text(3,8,"boxed italics text in data coords",style=‘italic‘,bbox={‘facecolor‘:‘red‘,‘alpha‘:0.5,‘pad‘:10})
ax.text(2,6,r‘an eauation: $E=mc^2$‘,fontsize=20)
ax.text(0.95,0.01,‘colored text in axes coords‘,verticalalignment=‘bottom‘,horizontalalignment=‘right‘,transform=ax.transAxes, color=‘green‘,fontsize=15)
ax.plot([2],[1],‘o‘)

ax.annotate(‘annotate‘,xy=(2,1),xytext=(3,4),arrowprops = dict(facecolor=‘blue‘,shrink=0.1))
ax.axis([0,10,0,12])
plt.show()
标签:
原文地址:http://www.cnblogs.com/jkmiao/p/4437163.html