标签:style blog http java color strong
eclipse创建web项目
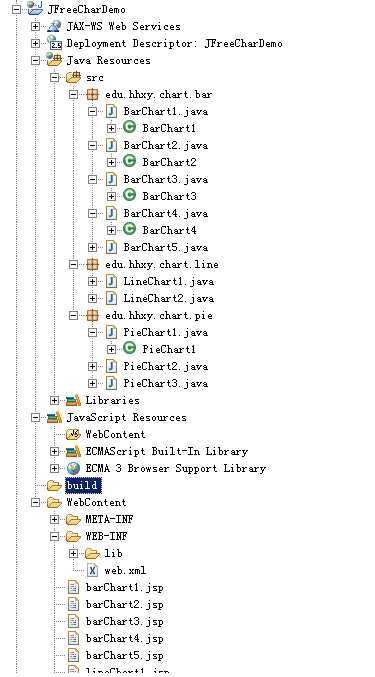
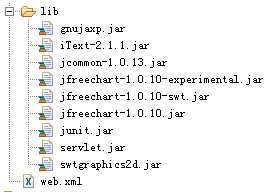
引入jar包
在web.xml中配置DisplayChart
<?xml version="1.0" encoding="UTF-8"?>
<web-app xmlns:xsi="http://www.w3.org/2001/XMLSchema-instance"
    xmlns="http://java.sun.com/xml/ns/javaee" xmlns:web="http://java.sun.com/xml/ns/javaee/web-app_2_5.xsd"
    xsi:schemaLocation="http://java.sun.com/xml/ns/javaee http://java.sun.com/xml/ns/javaee/web-app_2_5.xsd"
    id="WebApp_ID" version="2.5">
    <display-name>JFreeChartDemo</display-name>
    <welcome-file-list>
        <welcome-file>index.html</welcome-file>
        <welcome-file>index.htm</welcome-file>
        <welcome-file>index.jsp</welcome-file>
        <welcome-file>default.html</welcome-file>
        <welcome-file>default.htm</welcome-file>
        <welcome-file>default.jsp</welcome-file>
    </welcome-file-list>

    <servlet>
        <servlet-name>DisplayChart</servlet-name>
        <servlet-class>org.jfree.chart.servlet.DisplayChart</servlet-class>
    </servlet>
    <servlet-mapping>
        <servlet-name>DisplayChart</servlet-name>
        <url-pattern>/DisplayChart</url-pattern>
    </servlet-mapping>
</web-app>
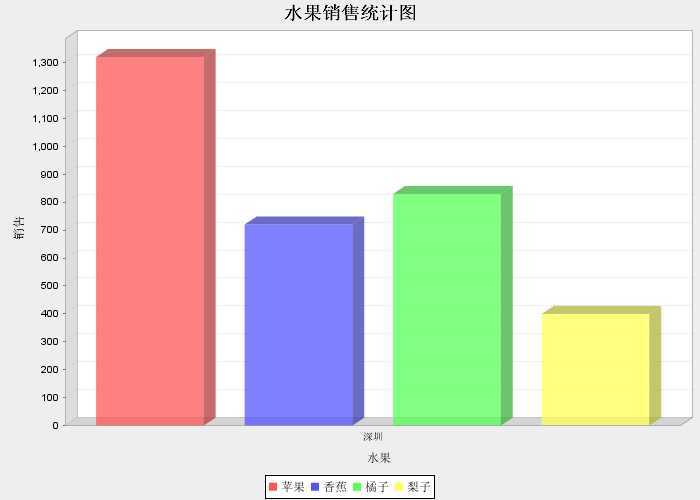
柱状图
(以此为例子,下面各个都一样)
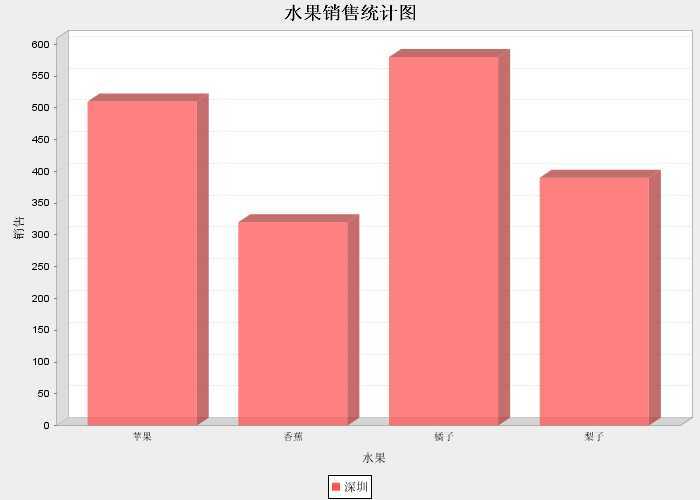
1,edu.hhxy.chart.bar.BarChart1
package edu.hhxy.chart.bar;

import javax.servlet.http.HttpSession;

import org.jfree.chart.ChartFactory;
import org.jfree.chart.JFreeChart;
import org.jfree.chart.plot.PlotOrientation;
import org.jfree.chart.servlet.ServletUtilities;
import org.jfree.data.category.DefaultCategoryDataset;

public class BarChart1 {
    public static String genBarChart(HttpSession session) throws Exception {
        DefaultCategoryDataset dataset = new DefaultCategoryDataset();
        dataset.addValue(510, "深圳", "苹果");
        dataset.addValue(320, "深圳", "香蕉");
        dataset.addValue(580, "深圳", "橘子");
        dataset.addValue(390, "深圳", "梨子");
        JFreeChart chart=ChartFactory.createBarChart3D("水果销售统计图", "水果", "销售", dataset,
                PlotOrientation.VERTICAL, true, true, true);
        String fileName=ServletUtilities.saveChartAsPNG(chart, 700, 500, null,session);
        return fileName;
    }
}
在barChart1.jsp引用
<%@page import="edu.hhxy.chart.bar.BarChart1"%>
<%@ page language="java" contentType="text/html; charset=utf-8"
    pageEncoding="utf-8"%>
<!DOCTYPE html PUBLIC "-//W3C//DTD HTML 4.01 Transitional//EN" "http://www.w3.org/TR/html4/loose.dtd">
<html>
<head>
<meta http-equiv="Content-Type" content="text/html; charset=utf-8">
<title>BarChart1</title>
</head>
<body>
    <%
        String fileName = BarChart1.genBarChart(session);//引入的BarChar1其它视情况而定
        System.out.println(fileName);
    %>
    <img src="DisplayChart?filename=<%=fileName%>" width="700"
        height="500" border="0" />
</body>
</html>
结果:
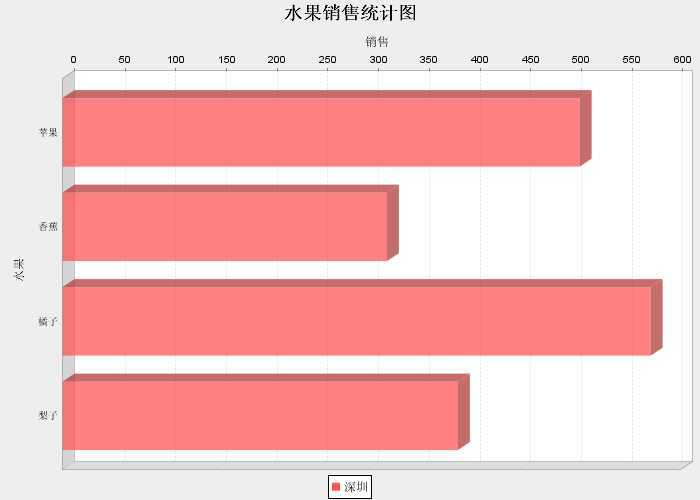
2、
package edu.hhxy.chart.bar;

import javax.servlet.http.HttpSession;

import org.jfree.chart.ChartFactory;
import org.jfree.chart.JFreeChart;
import org.jfree.chart.plot.PlotOrientation;
import org.jfree.chart.servlet.ServletUtilities;
import org.jfree.data.category.DefaultCategoryDataset;

public class BarChart2 {

    public static String genBarChart(HttpSession session) throws Exception {
        DefaultCategoryDataset dataset = new DefaultCategoryDataset();
        dataset.addValue(510, "深圳", "苹果");
        dataset.addValue(320, "深圳", "香蕉");
        dataset.addValue(580, "深圳", "橘子");
        dataset.addValue(390, "深圳", "梨子");
        JFreeChart chart=ChartFactory.createBarChart3D("水果销售统计图", "水果", "销售", dataset,
                PlotOrientation.HORIZONTAL, true, true, true);
        String fileName=ServletUtilities.saveChartAsPNG(chart, 700, 500, null,session);
        return fileName;
    }
}
3、
package edu.hhxy.chart.bar;

import javax.servlet.http.HttpSession;

import org.jfree.chart.ChartFactory;
import org.jfree.chart.JFreeChart;
import org.jfree.chart.plot.PlotOrientation;
import org.jfree.chart.servlet.ServletUtilities;
import org.jfree.data.category.CategoryDataset;
import org.jfree.data.general.DatasetUtilities;

public class BarChart3 {

    public static String genBarChart(HttpSession session) throws Exception {
        double [][]data=new double[][]{{1320},{720},{830},{400}};
        String []rowKeys={"苹果","香蕉","橘子","梨子"};
        String []columnKeys={"深圳"};
        CategoryDataset dataset=DatasetUtilities.createCategoryDataset(rowKeys,columnKeys ,data);
        JFreeChart chart=ChartFactory.createBarChart3D("水果销售统计图", "水果", "销售", dataset,
                PlotOrientation.VERTICAL, true, true, true);
        String fileName=ServletUtilities.saveChartAsPNG(chart, 700, 500, null,session);
        return fileName;
    }
}
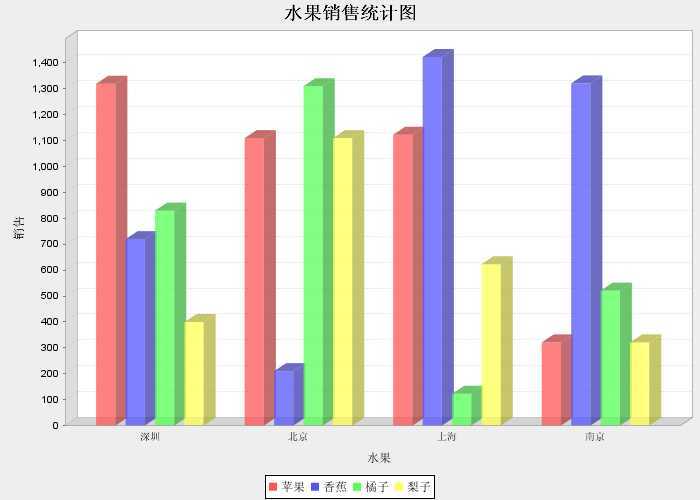
4、
package edu.hhxy.chart.bar;

import javax.servlet.http.HttpSession;

import org.jfree.chart.ChartFactory;
import org.jfree.chart.JFreeChart;
import org.jfree.chart.plot.PlotOrientation;
import org.jfree.chart.servlet.ServletUtilities;
import org.jfree.data.category.CategoryDataset;
import org.jfree.data.general.DatasetUtilities;

public class BarChart4 {

    public static String genBarChart(HttpSession session) throws Exception {
        double [][]data=new double[][]{{1320,1110,1123,321},{720,210,1423,1321},{830,1310,123,521},{400,1110,623,321}};
        String []rowKeys={"苹果","香蕉","橘子","梨子"};
        String []columnKeys={"深圳","北京","上海","南京"};
        CategoryDataset dataset=DatasetUtilities.createCategoryDataset(rowKeys,columnKeys ,data);
        JFreeChart chart=ChartFactory.createBarChart3D("水果销售统计图", "水果", "销售", dataset,
                PlotOrientation.VERTICAL, true, true, true);
        String fileName=ServletUtilities.saveChartAsPNG(chart, 700, 500, null,session);
        return fileName;
    }
}
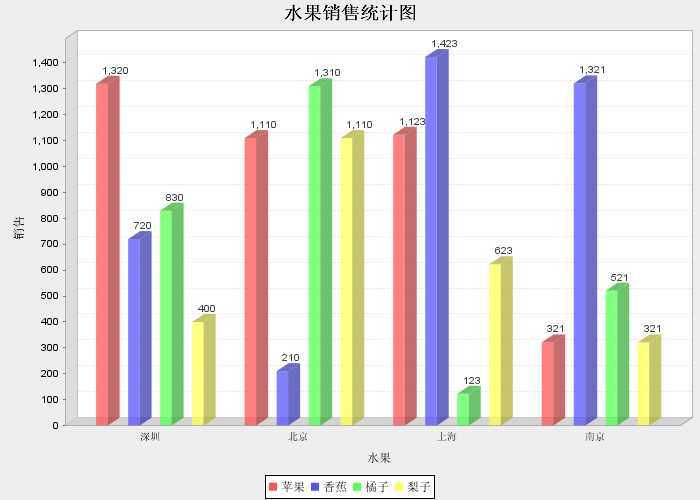
5、
package edu.hhxy.chart.bar;

import java.awt.Color;

import javax.servlet.http.HttpSession;

import org.jfree.chart.ChartFactory;
import org.jfree.chart.JFreeChart;
import org.jfree.chart.labels.ItemLabelAnchor;
import org.jfree.chart.labels.ItemLabelPosition;
import org.jfree.chart.labels.StandardCategoryItemLabelGenerator;
import org.jfree.chart.plot.CategoryPlot;
import org.jfree.chart.plot.PlotOrientation;
import org.jfree.chart.renderer.category.BarRenderer3D;
import org.jfree.chart.servlet.ServletUtilities;
import org.jfree.data.category.CategoryDataset;
import org.jfree.data.general.DatasetUtilities;
import org.jfree.ui.TextAnchor;

public class BarChart5 {

    public static String genBarChart(HttpSession session) throws Exception {
        double [][]data=new double[][]{{1320,1110,1123,321},{720,210,1423,1321},{830,1310,123,521},{400,1110,623,321}};
        String []rowKeys={"苹果","香蕉","橘子","梨子"};
        String []columnKeys={"深圳","北京","上海","南京"};
        CategoryDataset dataset=DatasetUtilities.createCategoryDataset(rowKeys,columnKeys ,data);
        JFreeChart chart=ChartFactory.createBarChart3D("水果销售统计图", "水果", "销售", dataset,
                PlotOrientation.VERTICAL, true, true, true);

        CategoryPlot plot=chart.getCategoryPlot();
        // 设置网格背景颜色
        plot.setBackgroundPaint(Color.white);
        // 设置网格竖线颜色
        plot.setDomainGridlinePaint(Color.pink);
        // 设置网格横线颜色
        plot.setRangeGridlinePaint(Color.pink);

        // 显示每个柱的数值,并修改该数值的字体属性
        BarRenderer3D renderer=new BarRenderer3D();
        renderer.setBaseItemLabelGenerator(new StandardCategoryItemLabelGenerator());
        renderer.setBaseItemLabelsVisible(true);

        renderer.setBasePositiveItemLabelPosition(new ItemLabelPosition(ItemLabelAnchor.OUTSIDE12, TextAnchor.BASELINE_LEFT));
        renderer.setItemLabelAnchorOffset(10D);

        // 设置平行柱的之间距离
        renderer.setItemMargin(0.4);

        plot.setRenderer(renderer);

        String fileName=ServletUtilities.saveChartAsPNG(chart, 700, 500, null,session);
        return fileName;
    }
}
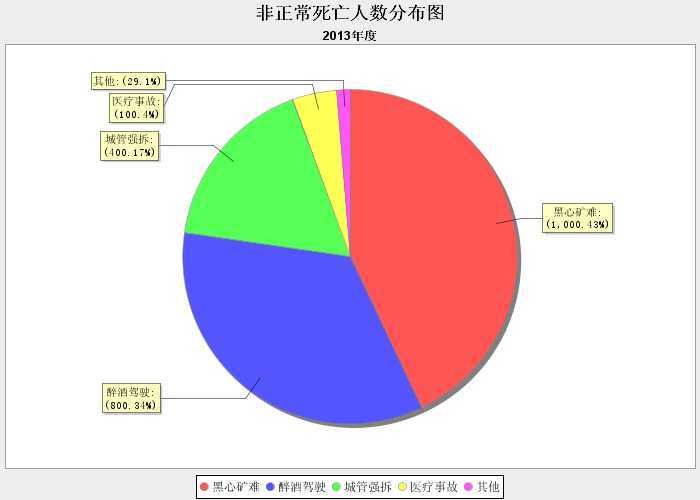
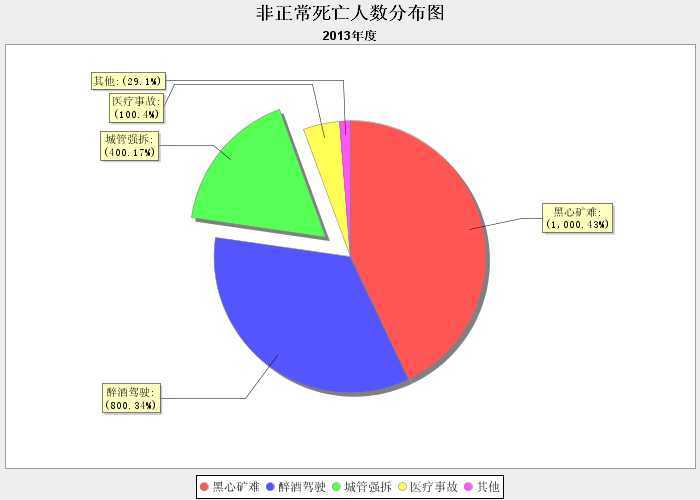
饼状图
1、
package edu.hhxy.chart.pie;

import java.awt.Font;
import java.text.NumberFormat;

import javax.servlet.http.HttpSession;

import org.jfree.chart.ChartFactory;
import org.jfree.chart.JFreeChart;
import org.jfree.chart.labels.StandardPieSectionLabelGenerator;
import org.jfree.chart.plot.PiePlot;
import org.jfree.chart.servlet.ServletUtilities;
import org.jfree.chart.title.TextTitle;
import org.jfree.data.general.DefaultPieDataset;

public class PieChart1 {

    public static String getPieChart(HttpSession session) throws Exception {
        DefaultPieDataset dataset = new DefaultPieDataset();
        dataset.setValue("黑心矿难", 1000);
        dataset.setValue("醉酒驾驶", 800);
        dataset.setValue("城管强拆", 400);
        dataset.setValue("医疗事故", 100);
        dataset.setValue("其他", 29);

        JFreeChart chart=ChartFactory.createPieChart("非正常死亡人数分布图", dataset, true, true, true);

        // 副标题
        chart.addSubtitle(new TextTitle("2013年度"));

        PiePlot pieplot=(PiePlot)chart.getPlot();
        pieplot.setLabelFont(new Font("宋体",0,11));
        // 设置饼图是圆的(true),还是椭圆的(false);默认为true
        pieplot.setCircular(true);
        // 没有数据的时候显示的内容
        pieplot.setNoDataMessage("无数据显示");
        StandardPieSectionLabelGenerator standarPieIG = new StandardPieSectionLabelGenerator("{0}:({1}.{2})", NumberFormat.getNumberInstance(), NumberFormat.getPercentInstance());
        pieplot.setLabelGenerator(standarPieIG);

        String fileName=ServletUtilities.saveChartAsPNG(chart, 700, 500, null, session);

        return fileName;
    }
}
2、
package edu.hhxy.chart.pie;

import java.awt.Font;
import java.text.NumberFormat;

import javax.servlet.http.HttpSession;

import org.jfree.chart.ChartFactory;
import org.jfree.chart.JFreeChart;
import org.jfree.chart.labels.StandardPieSectionLabelGenerator;
import org.jfree.chart.plot.PiePlot;
import org.jfree.chart.servlet.ServletUtilities;
import org.jfree.chart.title.TextTitle;
import org.jfree.data.general.DefaultPieDataset;

public class PieChart2 {

    public static String getPieChart(HttpSession session) throws Exception {
        DefaultPieDataset dataset = new DefaultPieDataset();
        dataset.setValue("黑心矿难", 1000);
        dataset.setValue("醉酒驾驶", 800);
        dataset.setValue("城管强拆", 400);
        dataset.setValue("医疗事故", 100);
        dataset.setValue("其他", 29);

        JFreeChart chart=ChartFactory.createPieChart("非正常死亡人数分布图", dataset, true, true, true);

        // 副标题
        chart.addSubtitle(new TextTitle("2013年度"));

        PiePlot pieplot=(PiePlot)chart.getPlot();
        pieplot.setLabelFont(new Font("宋体",0,11));
        // 设置饼图是圆的(true),还是椭圆的(false);默认为true
        pieplot.setCircular(true);
        // 没有数据的时候显示的内容
        pieplot.setNoDataMessage("无数据显示");
        StandardPieSectionLabelGenerator standarPieIG = new StandardPieSectionLabelGenerator("{0}:({1}.{2})", NumberFormat.getNumberInstance(), NumberFormat.getPercentInstance());
        pieplot.setLabelGenerator(standarPieIG);
        pieplot.setExplodePercent("城管强拆",0.23);

        String fileName=ServletUtilities.saveChartAsPNG(chart, 700, 500, null, session);

        return fileName;
    }
}
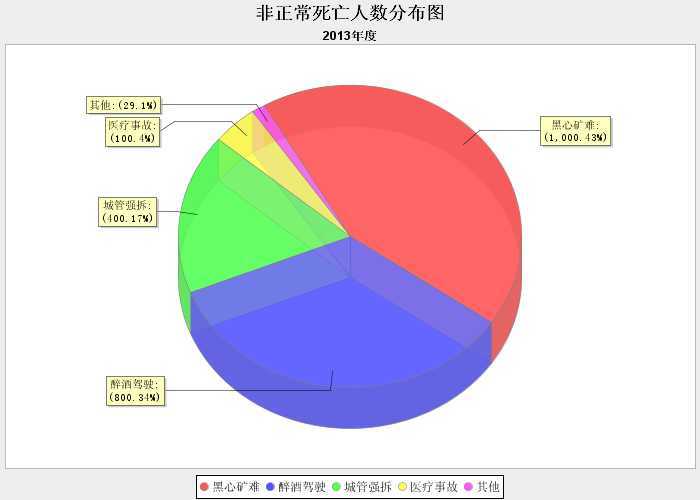
3、
package edu.hhxy.chart.pie;

import java.awt.Font;
import java.text.NumberFormat;

import javax.servlet.http.HttpSession;

import org.jfree.chart.ChartFactory;
import org.jfree.chart.JFreeChart;
import org.jfree.chart.labels.StandardPieSectionLabelGenerator;
import org.jfree.chart.plot.PiePlot;
import org.jfree.chart.plot.PiePlot3D;
import org.jfree.chart.servlet.ServletUtilities;
import org.jfree.chart.title.TextTitle;
import org.jfree.data.general.DefaultPieDataset;
import org.jfree.util.Rotation;

public class PieChart3 {

    public static String getPieChart(HttpSession session) throws Exception {
        DefaultPieDataset dataset = new DefaultPieDataset();
        dataset.setValue("黑心矿难", 1000);
        dataset.setValue("醉酒驾驶", 800);
        dataset.setValue("城管强拆", 400);
        dataset.setValue("医疗事故", 100);
        dataset.setValue("其他", 29);

        JFreeChart chart=ChartFactory.createPieChart3D("非正常死亡人数分布图", dataset, true, true, true);

        // 副标题
        chart.addSubtitle(new TextTitle("2013年度"));

        PiePlot pieplot=(PiePlot)chart.getPlot();
        pieplot.setLabelFont(new Font("宋体",0,11));
        // 设置饼图是圆的(true),还是椭圆的(false);默认为true
        pieplot.setCircular(true);
        // 没有数据的时候显示的内容
        pieplot.setNoDataMessage("无数据显示");
        StandardPieSectionLabelGenerator standarPieIG = new StandardPieSectionLabelGenerator("{0}:({1}.{2})", NumberFormat.getNumberInstance(), NumberFormat.getPercentInstance());
        pieplot.setLabelGenerator(standarPieIG);


        PiePlot3D pieplot3d = (PiePlot3D)chart.getPlot();

        //设置开始角度
        pieplot3d.setStartAngle(120D);
        //设置方向为”顺时针方向“
        pieplot3d.setDirection(Rotation.CLOCKWISE);
        //设置透明度,0.5F为半透明,1为不透明,0为全透明
        pieplot3d.setForegroundAlpha(0.7F);

        String fileName=ServletUtilities.saveChartAsPNG(chart, 700, 500, null, session);

        return fileName;
    }
}
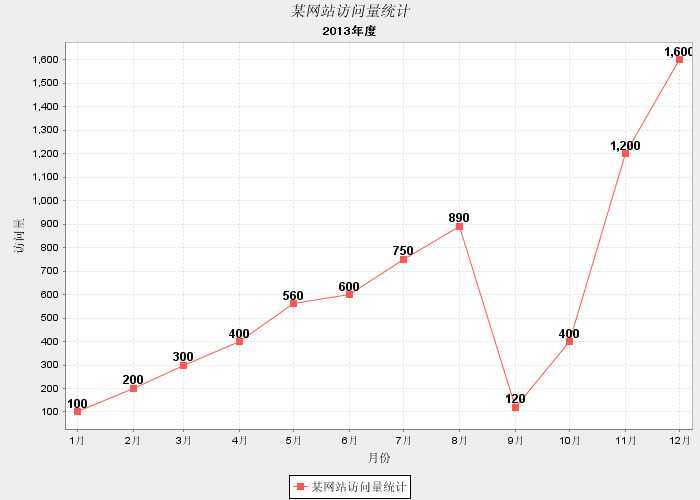
线状图
1、
package edu.hhxy.chart.line;

import java.awt.Font;

import javax.servlet.http.HttpSession;

import org.jfree.chart.ChartFactory;
import org.jfree.chart.JFreeChart;
import org.jfree.chart.axis.DateAxis;
import org.jfree.chart.axis.DateTickUnit;
import org.jfree.chart.labels.ItemLabelAnchor;
import org.jfree.chart.labels.ItemLabelPosition;
import org.jfree.chart.labels.StandardXYItemLabelGenerator;
import org.jfree.chart.plot.XYPlot;
import org.jfree.chart.renderer.xy.XYItemRenderer;
import org.jfree.chart.renderer.xy.XYLineAndShapeRenderer;
import org.jfree.chart.servlet.ServletUtilities;
import org.jfree.chart.title.TextTitle;
import org.jfree.data.time.Month;
import org.jfree.data.time.TimeSeries;
import org.jfree.data.time.TimeSeriesCollection;
import org.jfree.ui.TextAnchor;

public class LineChart1 {

    public static String genLineChart(HttpSession session)throws Exception{

        // 访问量统计
        TimeSeries timeSeries=new TimeSeries("某网站访问量统计", Month.class);
        // 添加数据
        timeSeries.add(new Month(1,2013), 100);
        timeSeries.add(new Month(2,2013), 200);
        timeSeries.add(new Month(3,2013), 300);
        timeSeries.add(new Month(4,2013), 400);
        timeSeries.add(new Month(5,2013), 560);
        timeSeries.add(new Month(6,2013), 600);
        timeSeries.add(new Month(7,2013), 750);
        timeSeries.add(new Month(8,2013), 890);
        timeSeries.add(new Month(9,2013), 120);
        timeSeries.add(new Month(10,2013), 400);
        timeSeries.add(new Month(11,2013), 1200);
        timeSeries.add(new Month(12,2013), 1600);

        // 定义时间序列的集合
        TimeSeriesCollection lineDataset=new TimeSeriesCollection();
        lineDataset.addSeries(timeSeries);

        JFreeChart chart=ChartFactory.createTimeSeriesChart("访问量统计时间折线图", "月份", "访问量", lineDataset, true, true, true);

        //设置主标题
        chart.setTitle(new TextTitle("某网站访问量统计", new Font("隶书", Font.ITALIC, 15)));
        //设置子标题
        TextTitle subtitle = new TextTitle("2013年度", new Font("黑体", Font.BOLD, 12));
        chart.addSubtitle(subtitle);
        chart.setAntiAlias(true);

        //设置时间轴的范围。
        XYPlot plot = (XYPlot) chart.getPlot();
        DateAxis dateaxis = (DateAxis)plot.getDomainAxis();
        dateaxis.setDateFormatOverride(new java.text.SimpleDateFormat("M月"));
        dateaxis.setTickUnit(new DateTickUnit(DateTickUnit.MONTH,1));

        //设置曲线是否显示数据点
        XYLineAndShapeRenderer xylinerenderer = (XYLineAndShapeRenderer)plot.getRenderer();
        xylinerenderer.setBaseShapesVisible(true);

        //设置曲线显示各数据点的值
        XYItemRenderer xyitem = plot.getRenderer();
        xyitem.setBaseItemLabelsVisible(true);
        xyitem.setBasePositiveItemLabelPosition(new ItemLabelPosition(ItemLabelAnchor.OUTSIDE12, TextAnchor.BASELINE_CENTER));
        xyitem.setBaseItemLabelGenerator(new StandardXYItemLabelGenerator());
        xyitem.setBaseItemLabelFont(new Font("Dialog", 1, 12));
        plot.setRenderer(xyitem);

        String fileName=ServletUtilities.saveChartAsPNG(chart, 700, 500, session);

        return fileName;
    }
}
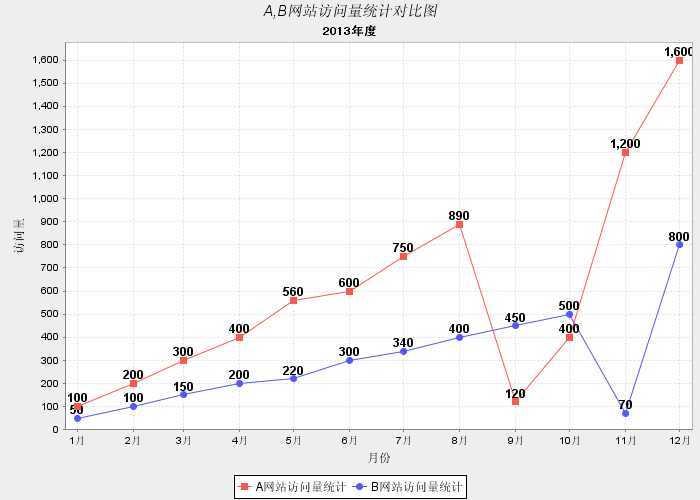
2、
package edu.hhxy.chart.line;

import java.awt.Font;

import javax.servlet.http.HttpSession;

import org.jfree.chart.ChartFactory;
import org.jfree.chart.JFreeChart;
import org.jfree.chart.axis.DateAxis;
import org.jfree.chart.axis.DateTickUnit;
import org.jfree.chart.labels.ItemLabelAnchor;
import org.jfree.chart.labels.ItemLabelPosition;
import org.jfree.chart.labels.StandardXYItemLabelGenerator;
import org.jfree.chart.plot.XYPlot;
import org.jfree.chart.renderer.xy.XYItemRenderer;
import org.jfree.chart.renderer.xy.XYLineAndShapeRenderer;
import org.jfree.chart.servlet.ServletUtilities;
import org.jfree.chart.title.TextTitle;
import org.jfree.data.time.Month;
import org.jfree.data.time.TimeSeries;
import org.jfree.data.time.TimeSeriesCollection;
import org.jfree.ui.TextAnchor;

public class LineChart2 {

    public static String genLineChart(HttpSession session)throws Exception{

        // 访问量统计
        TimeSeries timeSeries=new TimeSeries("A网站访问量统计", Month.class);
        // 添加数据
        timeSeries.add(new Month(1,2013), 100);
        timeSeries.add(new Month(2,2013), 200);
        timeSeries.add(new Month(3,2013), 300);
        timeSeries.add(new Month(4,2013), 400);
        timeSeries.add(new Month(5,2013), 560);
        timeSeries.add(new Month(6,2013), 600);
        timeSeries.add(new Month(7,2013), 750);
        timeSeries.add(new Month(8,2013), 890);
        timeSeries.add(new Month(9,2013), 120);
        timeSeries.add(new Month(10,2013), 400);
        timeSeries.add(new Month(11,2013), 1200);
        timeSeries.add(new Month(12,2013), 1600);

        // 访问量统计
        TimeSeries timeSeries2=new TimeSeries("B网站访问量统计", Month.class);
        // 添加数据
        timeSeries2.add(new Month(1,2013), 50);
        timeSeries2.add(new Month(2,2013), 100);
        timeSeries2.add(new Month(3,2013), 150);
        timeSeries2.add(new Month(4,2013), 200);
        timeSeries2.add(new Month(5,2013), 220);
        timeSeries2.add(new Month(6,2013), 300);
        timeSeries2.add(new Month(7,2013), 340);
        timeSeries2.add(new Month(8,2013), 400);
        timeSeries2.add(new Month(9,2013), 450);
        timeSeries2.add(new Month(10,2013), 500);
        timeSeries2.add(new Month(11,2013), 70);
        timeSeries2.add(new Month(12,2013), 800);

        // 定义时间序列的集合
        TimeSeriesCollection lineDataset=new TimeSeriesCollection();
        lineDataset.addSeries(timeSeries);
        lineDataset.addSeries(timeSeries2);

        JFreeChart chart=ChartFactory.createTimeSeriesChart("访问量统计时间折线图", "月份", "访问量", lineDataset, true, true, true);

        //设置主标题
        chart.setTitle(new TextTitle("A,B网站访问量统计对比图", new Font("隶书", Font.ITALIC, 15)));
        //设置子标题
        TextTitle subtitle = new TextTitle("2013年度", new Font("黑体", Font.BOLD, 12));
        chart.addSubtitle(subtitle);
        chart.setAntiAlias(true);

        //设置时间轴的范围。
        XYPlot plot = (XYPlot) chart.getPlot();
        DateAxis dateaxis = (DateAxis)plot.getDomainAxis();
        dateaxis.setDateFormatOverride(new java.text.SimpleDateFormat("M月"));
        dateaxis.setTickUnit(new DateTickUnit(DateTickUnit.MONTH,1));

        //设置曲线是否显示数据点
        XYLineAndShapeRenderer xylinerenderer = (XYLineAndShapeRenderer)plot.getRenderer();
        xylinerenderer.setBaseShapesVisible(true);

        //设置曲线显示各数据点的值
        XYItemRenderer xyitem = plot.getRenderer();
        xyitem.setBaseItemLabelsVisible(true);
        xyitem.setBasePositiveItemLabelPosition(new ItemLabelPosition(ItemLabelAnchor.OUTSIDE12, TextAnchor.BASELINE_CENTER));
        xyitem.setBaseItemLabelGenerator(new StandardXYItemLabelGenerator());
        xyitem.setBaseItemLabelFont(new Font("Dialog", 1, 12));
        plot.setRenderer(xyitem);

        String fileName=ServletUtilities.saveChartAsPNG(chart, 700, 500, session);

        return fileName;
    }
}
标签:style blog http java color strong
原文地址:http://www.cnblogs.com/jianfengyun/p/3813820.html