码迷,mamicode.com
首页 > 其他好文 > 详细

非常棒的jqChart图表插件

时间:2015-06-06 10:33:05      阅读:104      评论:0      收藏:0      [点我收藏+]

标签:

  由于项目需要,做一些类似于OA系统的应用时,表格用到的是最多的,那么图表展示就先显得尤为的重要,其中柱柱状图、折线图、饼状图又居多。

之前一直使用的是Chrome下的googleAPI中提供的chartAPI来进行表格的控制,其中对表格坐标的样式和细节调整做的比较好,但是一个不太好的问题是,很多关于googleAPI的东西需要远程加载,

而google CDN的加载和访问 有时候受到地域等一系列因素会很慢,导致页面报表迟迟无法生成,造成的用户体验下降还是有些明显的。

后来又接触了一下jQuery.plot的一款插件,效果也比较好。


$(document).ready(function () {
            var background = {
                type: ‘linearGradient‘,
                x0: 0,
                y0: 0,
                x1: 0,
                y1: 1,
                colorStops: [{ offset: 0, color: ‘#d2e6c9‘ },
                             { offset: 1, color: ‘white‘}]
            };
            $(‘#jqChart‘).jqChart({
                title: { text: ‘Axis Settings‘ },//图表标题
                border: { strokeStyle: ‘#6ba851‘ },//边线颜色
                background: background,/*背景渐变色的调整*/
                animation: { duration: 1 },//动画效果
                /*crosshairs: {
                      enabled: true, // specifies whether the crosshairs are visible
                      snapToDataPoints: true, // specifies whether the crosshairs span to data points
                      hLine: { visible: true, strokeStyle: ‘red‘ }, // horizontal line options
                      vLine: { visible: true, strokeStyle: ‘red‘ } // vertical line options
                 },//十字准线样式修改*/
                 /* paletteColors :{
                          type: ‘default‘, // default, grayscale, customColors
                          customColors : undefined
                  },//t调色板*/
                  /*legend: {//标注的一些样式修改
                      title: { margin: 0 }, // legend title
                      border: { 
                                padding: 2, 
                                strokeStyle: ‘grey‘, 
                                cornerRadius: 6 
                              }, // legend border
                      font: ‘12px sans-serif‘, // item text font
                      textFillStyle: ‘black‘,  // item text color
                      textLineWidth: 0, // item text border line width
                      textStrokeStyle : undefined,  // item text border color
                      background: undefined, // legend background
                      margin: 4, // legend margings
                      visible : true // specifies if the legend is visible
                 },*/
                axes: [/*此处是对轴线的一些优化*/
                        {
                            location: ‘left‘,
                            minimum: 10,
                            maximum: 700,
                            interval: 100
                        }
                      ],
                series: [
                            {
                                title:"班级排名",
                                type: ‘line‘,
                                data: [
                                      [‘1-1班‘,  1],
                                      [‘1-2班‘,  20],
                                      [‘1-3班‘,   60],
                                      [‘1-4班‘,  500],
                                      [‘1-5班‘,  300],
                                      [‘1-6班‘,  200],
                                      [‘2-1班‘,  268],
                                      [‘2-2班‘,  423],
                                      [‘2-3班‘,  321],
                                      [‘2-4班‘,  456],
                                      [‘2-5班‘,  385],
                                      [‘2-6班‘,  578],
                                      [‘3-1班‘,  512],
                                      [‘3-2班‘,  456],
                                      [‘3-3班‘,  478],
                                      [‘3-4班‘,  356],
                                      [‘3-5班‘,  478],
                                      [‘3-6班‘,  189]
                                ]
                            },
                             {
                                title:"排名",
                                type: ‘line‘,
                                data: [
                                      [‘1-1班‘,  200],
                                      [‘1-2班‘,  20],
                                      [‘1-3班‘,  160],
                                      [‘1-4班‘,  200],
                                      [‘1-5班‘,  330],
                                      [‘1-6班‘,  20],
                                      [‘2-1班‘,  68],
                                      [‘2-2班‘,  463],
                                      [‘2-3班‘,  321],
                                      [‘2-4班‘,  486],
                                      [‘2-5班‘,  300],
                                      [‘2-6班‘,  508],
                                      [‘3-1班‘,  312],
                                      [‘3-2班‘,  616],
                                      [‘3-3班‘,  178],
                                      [‘3-4班‘,  556],
                                      [‘3-5班‘,  178],
                                      [‘3-6班‘,  489]
                                ]
                            }
                        ]
            });
        });


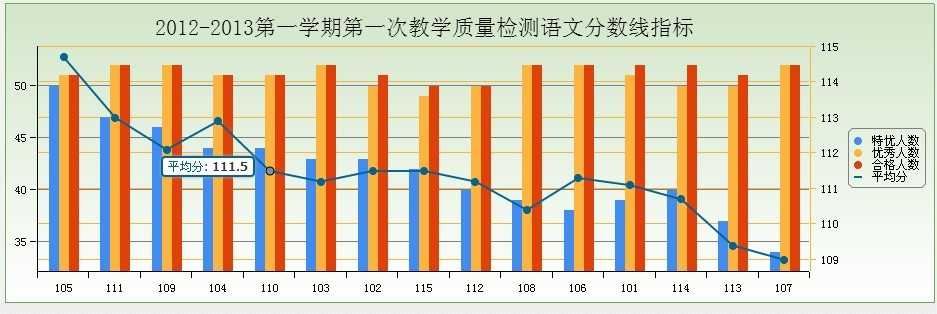
通过这种方式可以制作出精美的图标,图标展示如下图所示,做好的
技术分享

之后就用到了JQChart 大家的反响都不错,数据的生成多样,表格展示也很不错,但是某些情况下不适合大数据量的报表使用,会造成在局部范围内坐标轴 X值的显示错位问题,google很好的解决了这个问题,但是

这款插件目前还无法解决这一问题,但是可以用过添加水平滚动等方式,处理这一类问题,但是本人更倾向于一次性展示出来。

下面就大概的来说一下jqChart插件中的一些options的使用

非常棒的jqChart图表插件

标签:

原文地址:http://www.cnblogs.com/a757956132/p/4556057.html

(0)
(0)
   
举报
评论 一句话评论(0
登录后才能评论!
© 2014 mamicode.com 版权所有  联系我们:gaon5@hotmail.com
迷上了代码!