标签:
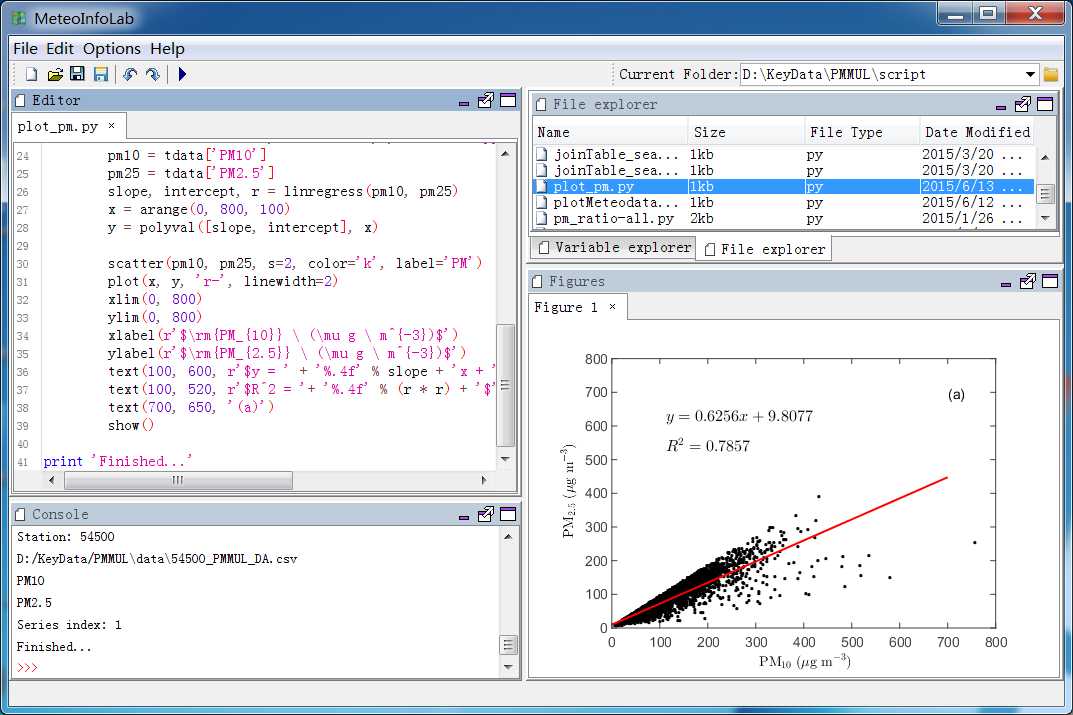
MeteoInfoLab提供一个线性拟合函数linregress,参数是参与拟合的两个数据序列,返回拟合的斜率、截距和相关系数。有了上述拟合参数可以用polyval函数生成拟合数据(直线)。然后可以将数据、拟合线、公式等绘图。

脚本程序:
fn = os.path.join(‘D:/KeyData/PMMUL/data/54500_PMMUL_DA.csv‘)
if os.path.exists(fn):
    print fn
    tdata = readtable(fn, delimiter=‘,‘, format=‘%{yyyyMMdd}D%f%f%f%i%i%i‘)
    pm10 = tdata[‘PM10‘]
    pm25 = tdata[‘PM2.5‘]
    slope, intercept, r = linregress(pm10, pm25)
    x = arange(0, 800, 100)
    y = polyval([slope, intercept], x)

    scatter(pm10, pm25, s=2, color=‘k‘, label=‘PM‘)
    plot(x, y, ‘r-‘, linewidth=2)
    xlim(0, 800)
    ylim(0, 800)
    xlabel(r‘$\rm{PM_{10}} \ (\mu g \ m^{-3})$‘)
    ylabel(r‘$\rm{PM_{2.5}} \ (\mu g \ m^{-3})$‘)
    text(100, 600, r‘$y = ‘ + ‘%.4f‘ % slope + ‘x + ‘ + ‘%.4f‘ % intercept + ‘$‘, fontsize=16)
    text(100, 520, r‘$R^2 = ‘+ ‘%.4f‘ % (r * r) + ‘$‘, fontsize=16)
    text(700, 650, ‘(a)‘)
    show()

print ‘Finished...‘
标签:
原文地址:http://www.cnblogs.com/yaqiang/p/4587709.html