标签:
感觉这个主题是和一个主题是一个系列,而且更基础。
准备深入研究一下。。。
相关文档准备:
https://www.zabbix.com/documentation/2.0/manual/discovery/low_level_discovery
http://itnihao.blog.51cto.com/1741976/1129725
Low-level discovery provides a way to automatically create items, triggers, and graphs for different entities on a computer. For instance, Zabbix can automatically start monitoring file systems or network interfaces on your machine, without the need to create items for each file system or network interface manually. Additionally it is possible to configure Zabbix to remove unneeded entities automatically based on actual results of periodically performed discovery.
In Zabbix 2.0, three types of item discovery are supported out of the box:
A user can define their own types of discovery, provided they follow a particular JSON protocol.
The general architecture of the discovery process is as follows.
First, a user creates a discovery rule in “Configuration” → “Templates” → “Discovery” column. A discovery rule consists of (1) an item that discovers the necessary entities (for instance, file systems or network interfaces) and (2) prototypes of items, triggers, and graphs that should be created based on the value of that item.
An item that discovers the necessary entities is like a regular item seen elsewhere: the server asks a Zabbix agent (or whatever the type of the item is set to) for a value of that item, the agent responds with a textual value. The difference is that the value the agent responds with should contain a list of discovered entities in a specific JSON format. While the details of this format are only important for implementers of custom discovery checks, it is necessary to know that the returned value contains a list of macro → value pairs. For instance, item “net.if.discovery” might return two pairs: “{#IFNAME}” → “lo” and “{#IFNAME}” → “eth0”.
~~~~~~~~~~~~~~~~~~~~~~~~~~~~~~~~
需求:
现在有大量url需要监控,形式如http://itnihao.blog.51cto.com ,要求url状态不为200即报警。
需求详细分析:
大量的url,且url经常变化,现在监控用的是zabbix,如果手动添加模板,会造成大量重复工作,造成人力财力的浪费,造成休息时间的浪费,得不尝失,如果利用脚本+mail,无法图形呈现
解决方案:
zabbix有discovery功能,利用此功能,即可轻松解决此问题
zabbix客户端配置
#########cat /etc/zabbix/zabbix_agentd.conf|grep -v "^#"|grep -v "^$"##########
##此处省略N多信息,
Include=/etc/zabbix/zabbix_agentd.conf.d/ #配置文件路径
UnsafeUserParameters=1 #自定义key
###########自动发现脚本编写
########################cat /etc/zabbix/scripts/web_site_code_status##############
#!/bin/bash
# function:monitor tcp connect status from zabbix
# License: GPL
# mail:itnihao@qq.com
# version:1.0 date:2012-12-09
source /etc/bashrc >/dev/null 2>&1
source /etc/profile >/dev/null 2>&1
#/usr/bin/curl -o /dev/null -s -w %{http_code} http://$1/
WEB_SITE_discovery () {
WEB_SITE=($(cat WEB1.txt|grep -v "^#"))
printf ‘{\n‘
printf ‘\t"data":[\n‘
for((i=0;i<${#WEB_SITE[@]};++i))
{
num=$(echo $((${#WEB_SITE[@]}-1)))
if [ "$i" != ${num} ];
then
printf "\t\t{ \n"
printf "\t\t\t\"{#SITENAME}\":\"${WEB_SITE[$i]}\"},\n"
else
printf "\t\t{ \n"
printf "\t\t\t\"{#SITENAME}\":\"${WEB_SITE[$num]}\"}]}\n"
fi
}
}
web_site_code () {
/usr/bin/curl -o /dev/null -s -w %{http_code} http://$1
}
case "$1" in
web_site_discovery)
WEB_SITE_discovery
;;
web_site_code)
web_site_code $2
;;
*)
echo "Usage:$0 {web_site_discovery|web_site_code [URL]}"
;;
esac
客户端配置文件
#########cat /etc/zabbix/zabbix_agentd.conf.d/web_site_discovery.conf ###########
UserParameter=web.site.discovery,/etc/zabbix/scripts/web_site_code_status web_site_discovery
UserParameter=web.site.code[*],/etc/zabbix/scripts/web_site_code_status web_site_code $1
域名如下
######### cat /etc/zabbix/scripts/WEB.txt###########
www.qq.com
www.baidu.com
www.sina.com.cn
测试:
zabbix_get -s 127.0.0.1 -k web.site.discovery
zabbix_get -s 127.0.0.1 -k web.site.code[www.qq.com]
此时返回状态为200
至此,脚本,客户端配置文件OK
接下来是web的添加


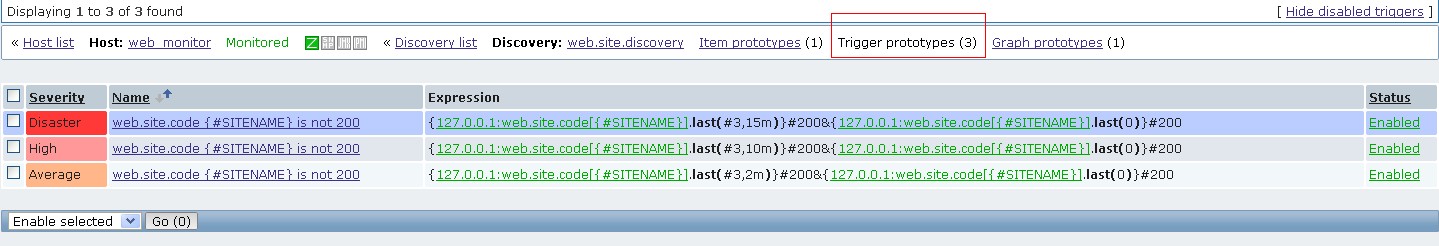
报警级别的设置:3个报警级别

利用以上方法,哪怕是1000个url监控,也是分分钟的事情
总结:工欲善其事,必先利其器
参考文档:https://www.zabbix.com/documentation/2.0/manual/discovery/low_level_discovery
此外,还可以参考我写的文档:http://code.google.com/p/auto-task-pe/downloads/list zabbix自动发现监控http端口.pdf 如遇到问题,请先仔细阅读这2个文档,另外附模板文件。
欢迎交流。
http://my.itwnik.com/2013/03/zabbix-low-level-discovery-rule-script-for-md-devices/
~~~~~~~~~~~~~~~~~~~~~~~~~~~~~~~~~~~~~~~~~~~~
应用一则:
zabbix实现对web的监控有两种方式实现,一种是自带的web scenarios,基本能够实现大部分web监控的需求,但是方便简易性差很多;另一种是利用脚本+lld,可以实现任一机
器上的所有url监控,我们只需手动添加要监控的url,再加上zabbix模版的功能,就能够轻而易举的应用到所需要的监控的服务器上。
首先要感线itnihao童鞋提供的这种方式,博客地址为http://itnihao.blog.51cto.com/1741976/1129725
1.zabbix客户端配置
vim /etc/zabbix/zabbix_agent.conf
Include=/etc/zabbix/zabbix_agentd.conf
UnsafeUserParameters=1
允许用户使用自定义的参数进行传递
2.脚本及参数
[root@localhost zabbix]# tree
.
├── monitor_scripts
│ ├── discovertcpport.sh
│ ├── web_site_code_status.sh
│ └── WEB.txt
├── zabbix_agentd.conf
└── zabbix_agentd.d
├── userparameter_mysql.conf
└── web_site_discovery.conf
(1)zabbix传递参数及配置文件
[root@localhost zabbix]# cat zabbix_agentd.d/web_site_discovery.conf
UserParameter=web.site.discovery,/etc/zabbix/monitor_scripts/web_site_code_status.sh web_site_discovery
UserParameter=web.site.code[*],/etc/zabbix/monitor_scripts/web_site_code_status.sh web_site_code $1
(2)zabbix自动监控脚本
[root@localhost zabbix]# cat monitor_scripts/web_site_code_status.sh
#!/bin/bash
#function:monitor web site code status from zabbix
WEB_SITE_discovery(){
WEB_SITE=($(cat /etc/zabbix/monitor_scripts/WEB.txt |grep -v "^#"))
printf ‘{\n‘
printf ‘\t"data":[\n‘
for((i=0;i<${#WEB_SITE[@]};i++))
{
num=$(echo $((${#WEB_SITE[@]}-1)))
if [ "$i" != ${num} ];then
printf "\t\t{ \n"
printf "\t\t\t\"{#SITENAME}\":\"${WEB_SITE[$i]}\"},\n"
else
printf "\t\t{ \n"
printf "\t\t\t\"{#SITENAME}\":\"${WEB_SITE[$num]}\"}]}\n"
fi
}
}
web_site_code(){
/usr/bin/curl -o /dev/null -s -w %{http_code} http://$1
}
case "$1" in
web_site_discovery)
WEB_SITE_discovery
;;
web_site_code)
web_site_code $2
;;
*)
echo "Usage:$0 {web_site_discovery|web_site_code[URL]}"
;;
esac
(3)需要监控的url在WEB.TXT中
[root@localhost zabbix]# cat monitor_scripts/WEB.txt
s1.xd.com/Default.aspx
s2.xd.com/Default.aspx
3.在zabbix服务端进行监控测试
[root@83 yum.repos.d]# /usr/bin/zabbix_get -s 192.168.1.211 -p 10050 -k web.site.code[s1.xd.com/Default.aspx]
200
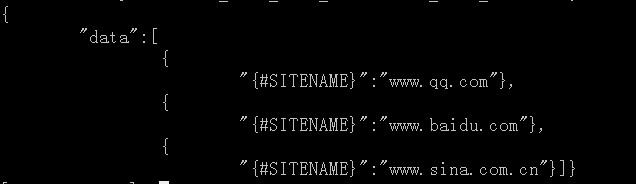
[root@83 yum.repos.d]# /usr/bin/zabbix_get -s 192.168.1.211 -p 10050 -k web.site.discovery
{
"data":[
{
"{#SITENAME}":"s1.xd.com/Default.aspx"},
{
"{#SITENAME}":"s2.xd.com/Default.aspx"}]}
测试成功
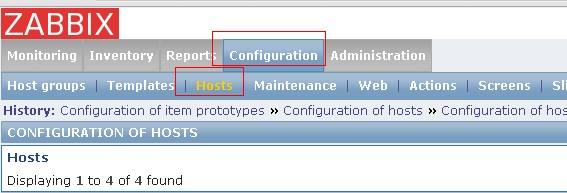
4.下面我们来配置下discovery模版,配好后直接应用到服务器即可。
(1)创建模版,并应用到需要监控的服务器上
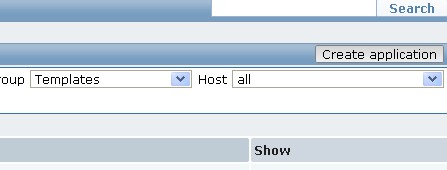
(2)在新建的Template Web Monitor模版的Application中创建新应用
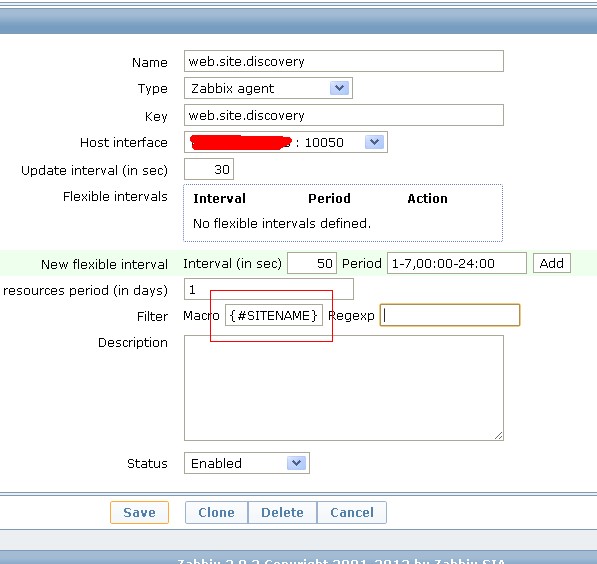
(3)在在新建的Template Web Monitor模版的Discovery rules中创建新rule
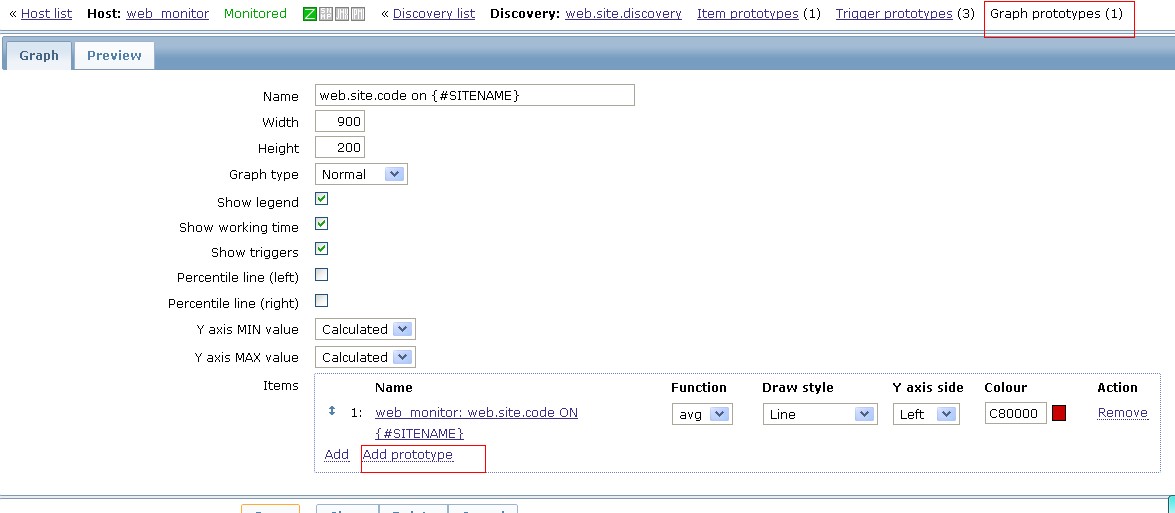
(4)在新建的web.site.discovery中创建Item porototyoed
(5)在新建的web.site.discovery中创建Trigger porotypes,此处设置为状态码大于399就报警。
ok,配置完后我们的web url监控就完成了
~~~~~~~~~~~~~~~~~~~~~~~~~~~~~~~
Zabbix的LLD功能--Low-level discovery
标签:
原文地址:http://www.cnblogs.com/aguncn/p/4592708.html


