标签:
这里用美国做例子,有一个美国区域的格点温度场数据(usgrid.data),需要计算出每个州(state)的平均温度。当然需要有一个包含各州行政区域的shape文件了(相关文件可以在此帖中下载:http://bbs.06climate.com/forum.p ... d=11070&fromuid=106)。首先读取格点数据数组,然后读取states.shp文件生成us图层,对us图层所有的图元(shape,每个图元就是一个州)遍历,对于每个州,利用该州的图元maksout格点数据,然后求平均值、最大值和最小值,并打印出来(当然也可以输出到文件中,具体在网上找python输出文本文件的例子)。后面的绘图语句只是为了看看数据的分布情况。
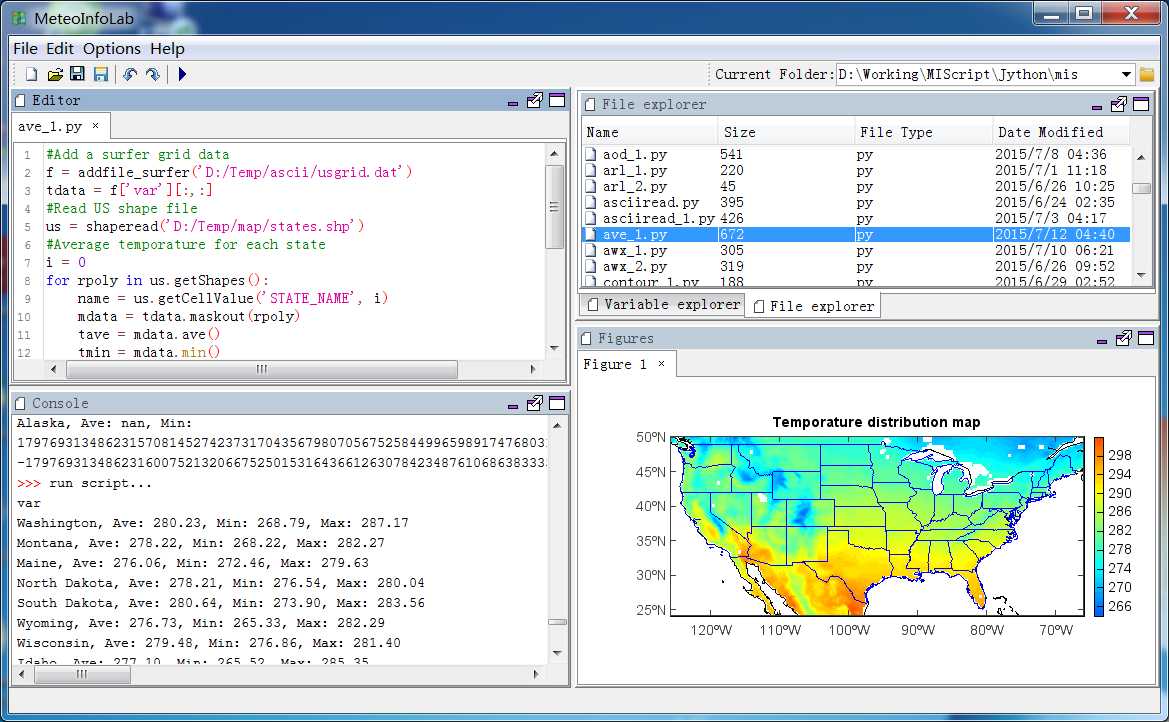
脚本程序:
#Add a surfer grid data
f = addfile_surfer(‘D:/Temp/ascii/usgrid.dat‘)
tdata = f[‘var‘][:,:]
#Read US shape file
us = shaperead(‘D:/Temp/map/states.shp‘)
#Average temporature for each state
i = 0
for rpoly in us.getShapes():
    name = us.getCellValue(‘STATE_NAME‘, i)
    mdata = tdata.maskout(rpoly)
    tave = mdata.ave()
    tmin = mdata.min()
    tmax = mdata.max()
    print name + ‘, Ave: %.2f, Min: %.2f, Max: %.2f‘ %(tave, tmin, tmax)
    i += 1

#Plot
axesm()
world = shaperead(‘D:/Temp/map/country1.shp‘)
geoshow(world)
geoshow(us, edgecolor=[0,0,255])
layer = contourfm(tdata,20)
title(‘Temporature distribution map‘)
colorbar(layer)
标签:
原文地址:http://www.cnblogs.com/yaqiang/p/4641198.html