标签:
image - Display image object
Description
image creates an image graphics object by interpreting each element in a matrix as an index into the figure‘s colormap or directly as RGB values, depending on the data specified.
The image function has two forms:
A high-level function that calls newplot to determine where to draw the graphics objects and sets the following axes properties:
- XLim and YLim to enclose the image
- Layer to top to place the image in front of the tick marks and grid lines
- YDir to reverse
- View to [0 90]
A low-level function that adds the image to the current axes without calling newplot. The low-level function argument list can contain only property name/property value pairs.
You can specify properties as property name/property value pairs, structure arrays, and cell arrays (see set and get for examples of how to specify these data types).
(本博客系原创,转载请注明出处:http://www.cnblogs.com/pfli1995/p/4659966.html)
(博主cnds中对应文章:http://blog.csdn.net/xuexiyanjiusheng/article/details/46959893)
Examples
Load MAT-File and Display Image(第一个例子)
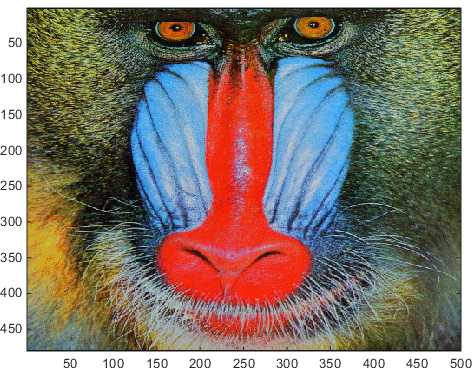
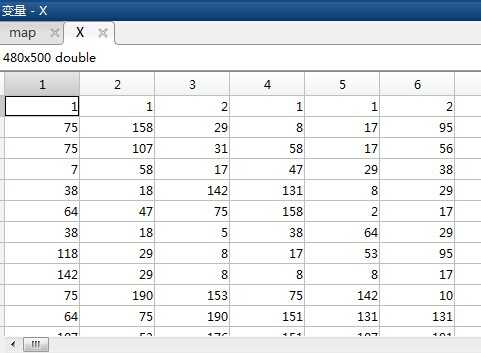
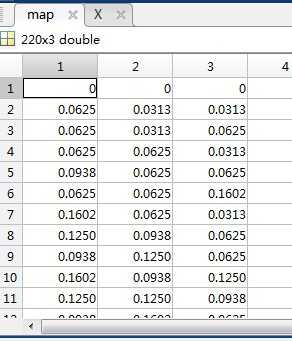
Load the mandrill file which contains an indexed image, X, and its associated colormap, map. Display the image using its colormap.
load mandrill
image(X)
colormap(map)
注意:
如果只输入
load mandrill
得到矩阵 X 和 map
值得注意的是,image 可以直接对 0~255 范围内的 double 型数据进行操作,得到图像,而 imshow 是只能对 0~1 范围内的 double 数据操作得到正确图像的。
这里,再输入
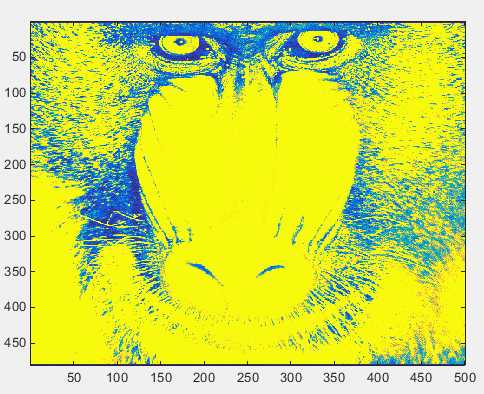
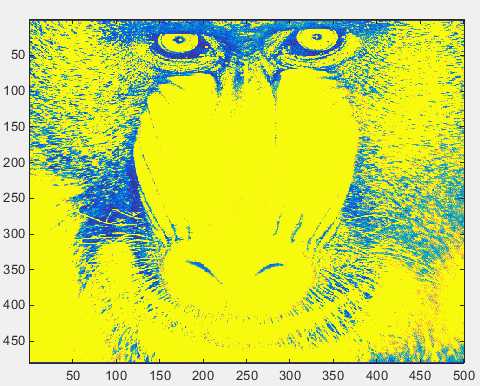
image(X)
得到的图像如下:
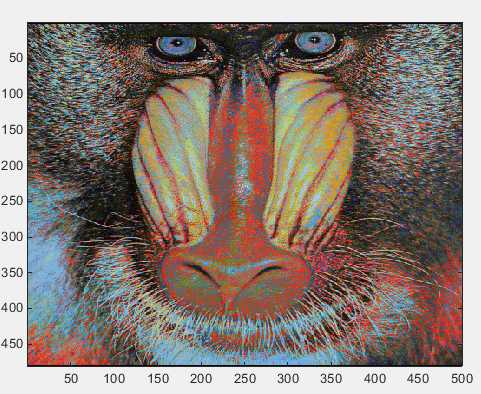
再继续输入
colormap(map)
后,图像变成正确的彩色。
另外值得说明的是:博主将得到的 X 矩阵 转换为 uint8 型,即 X1 = uint8(X) ,map 不变后
image(X1)
得到的图像如下:
看起来没有多大变化,继续
colormap(map)
得到的图像却是下面的形式的:
博主也不是很明白其中的原因。(由于map里面的 double 是 0~1 范围内的,转化为 uint8 后会变成 0 ,所以没有变 map )
Remove the axis tick marks and tick labels.
Set the aspect ratio to obtain square pixels.
axis off
axis image
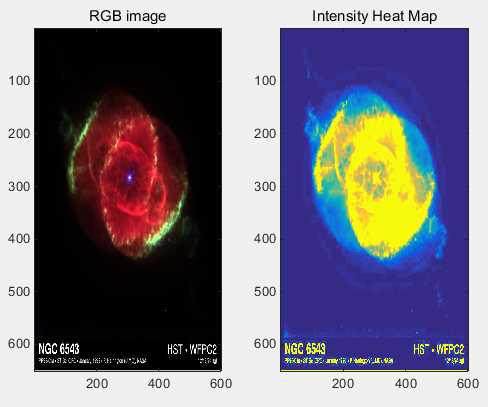
Load and Display JPEG Image File(第二个例子)
Load a JPEG image file of the Cat‘s Eye Nebula from the Hubble Space Telescope (image courtesy NASA). Display the original image using its RGB color values (left) as a subplot.
Create a linked subplot (same size and scale) to display the transformed intensity image as a heat map (right).
figure
ax(1) = subplot(1,2,1);
rgb = imread(‘ngc6543a.jpg‘);
image(rgb)
title(‘RGB image‘)

ax(2) = subplot(1,2,2);
im = mean(rgb,3);

%mean(A,dim) returns the mean along dimension dim.
%For example, if A is a matrix, then mean(A,2) is a column vector containing the mean of each row

image(im)
title(‘Intensity Heat Map‘)
colormap(hot(256))
linkaxes(ax,‘xy‘)%同步缩放坐标轴
axis(ax,‘image‘)
一步一步的运行程序得到的结果如下:
figure
ax(1) = subplot(1,2,1);
rgb = imread(‘ngc6543a.jpg‘);
image(rgb)
title(‘RGB image‘)
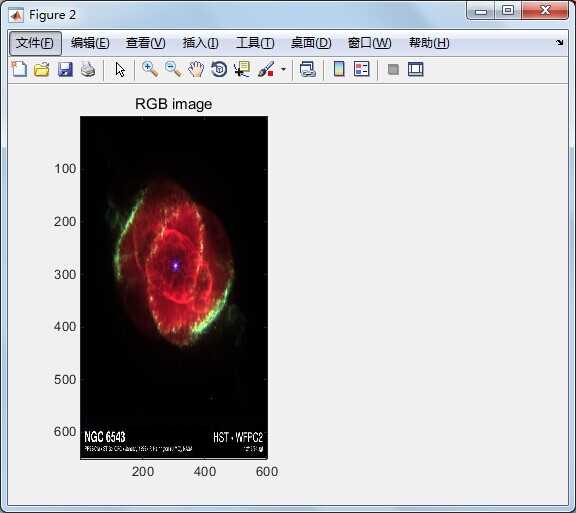
这里 image 和 imshow 一样,作用于一个 3 维的 uint8 型矩阵,得到彩色的图形。
需要注意的是,经过博主验证,此时对于 image 而言,uint8 和 double 型的数据也和 imshow 一样有范围的限制,即 uint8: 0~255; double: 0~1.
(和前面的用法有所区别)
ax(2) = subplot(1,2,2);
im = mean(rgb,3);
image(im)
title(‘Intensity Heat Map‘)
注意:此时的 im 为650*600 double 型的矩阵。
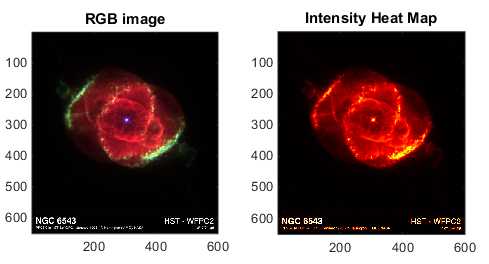
colormap(hot(256))
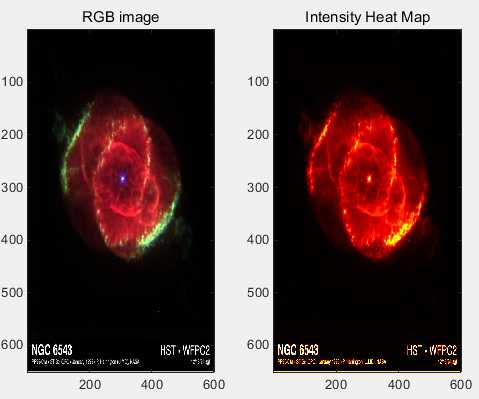
linkaxes(ax,‘xy‘)%同步缩放坐标轴
axis(ax,‘image‘)
标签:
原文地址:http://www.cnblogs.com/pfli1995/p/4659966.html