标签:
2.3.1 Basic Commands
create an array
x = c(1,6,2)
create a matrix
>x=matrix (data=c(1,2,3,4) , nrow=2, ncol =2)

> x=matrix (c(1,2,3,4) ,2,2)

> x[1,2]
[1] 3
> matrix (c(1,2,3,4) ,2,2,byrow =TRUE), then populate by rows
[,1] [,2]
[1,] 1 2
[2,] 3 4
ls() function allows us to look at a list of all of the objects
> ls()

[1] "x" "y"
> rm(x,y)
> ls()
character (0)
rm all items
rm(list=ls())
get help for a function
?matrix
correlation coefficient
> x=rnorm (50)
> y=x+rnorm (50, mean=50, sd=.1)
> cor(x,y)
[1] 0.995
random quantities
use set.seed() throughout the labs whenever we perform calculations
involving random quantities. In general this should allow the user to reproduce
our results.
> set.seed (3)
> y=rnorm (100)
> mean(y)
[1] 0.0110
> var(y)
[1] 0.7329
> sqrt(var(y))
[1] 0.8561
> sd(y)
[1] 0.8561
2.3.2 Graphics
plot
> x=rnorm (100)
> y=rnorm (100)
> plot(x,y)
> plot(x,y,xlab=" this is the x-axis",ylab=" this is the y-axis",
main=" Plot of X vs Y")
make a sequence
x=seq(-1 ,2 ,length =50)
countour plot
> y=x
> f=outer(x,y,function (x,y)cos(y)/(1+x^2))
> contour (x,y,f)
> contour (x,y,f,nlevels =45, add=T)
> fa=(f-t(f))/2
> contour (x,y,fa,nlevels =15)
> image(x,y,fa)
> persp(x,y,fa)
> persp(x,y,fa ,theta =30)
> persp(x,y,fa ,theta =30, phi =20)
> persp(x,y,fa ,theta =30, phi =70)
> persp(x,y,fa ,theta =30, phi =40)
2.3.3 Indexing Data
Matrix 从1开始计位
> A=matrix (1:16 ,4 ,4)
> A
[,1] [,2] [,3] [,4]
[1,] 1 5 9 13
[2,] 2 6 10 14
[3,] 3 7 11 15
[4,] 4 8 12 16

> A[2,3]
[1] 10
非常诡异的排列
> A[c(1,3) ,c(2,4) ]
[,1] [,2]
[1,] 5 13
[2,] 7 15

就是A[1,2] A[1,4]
    A[3,2] A[3,4]
> A[1:3 ,2:4]
[,1] [,2] [,3]
[1,] 5 9 13
[2,] 6 10 14
[3,] 7 11 15

> A[1:2 ,]
[,1] [,2] [,3] [,4]
[1,] 1 5 9 13
[2,] 2 6 10 14

> A[ ,1:2]
[,1] [,2]
[1,] 1 5
[2,] 2 6
[3,] 3 7
[4,] 4 8
> A[1,]
[1] 1 5 9 13
> A[-c(1,3) ,]
[,1] [,2] [,3] [,4]
[1,] 2 6 10 14
[2,] 4 8 12 16
> A[-c(1,3) ,-c(1,3,4)]
[1] 6 8
> dim(A) tells dimension
2.3.4 Loading Data
1) change working directory
Rstudio 右下角 找到directory位置后,用more set 好working directory
2)
R has assumed that the variable names are part of the data and so has included them in the first row.
Using the option header=T (or header=TRUE) in the read.table() function tells R that the first line of the file contains the variable names, and using the option na.strings tells R that any time it sees a particular character or set of characters (such as a question mark), it should be treated as a missing element of the data matrix.
> Auto=read.table ("Auto.data", header =T,na.strings ="?")
> fix(Auto)
> dim(Auto)
[1] 397   9
3) missing value
use the na.omit() function to simply remove these rows.
> Auto=na.omit(Auto)
> dim(Auto)
[1] 392 9
4) use names() to check the variable names.
> names(Auto) 就是title那一行
[1] "mpg " "cylinders " " displacement" "horsepower "
[5] "weight " " acceleration" "year" "origin "
[9] "name"
2.3.5 Additional Graphical and Numerical Summaries
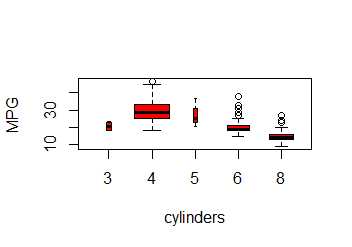
categorial, then boxplots
> plot(Auto$cylinders , Auto$mpg )
> attach (Auto)
> plot(cylinders , mpg)
there are only a small number of possible values for cylinders, one may prefer to treat it as a qualitative variable.
The as.factor() function converts quantitative variables into qualitative as.factor() variables.
> cylinders =as.factor (cylinders )
plot(cylinders , mpg , col ="red", varwidth =T, xlab=" cylinders ",
ylab ="MPG ")
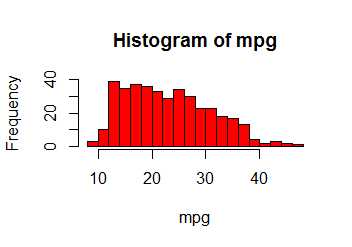
hist() function can be used to plot a histogram.
hist(mpg ,col =2, breaks =15)
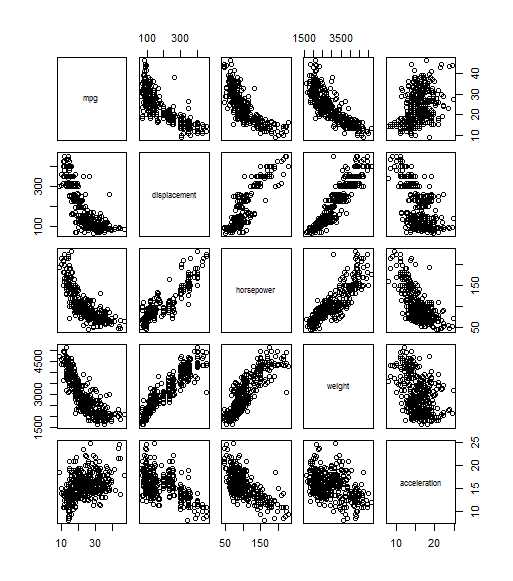
The pairs() function creates a scatterplot matrix i.e. a scatterplot for every pair of variables for any given data set. We can also produce scatterplots for just a subset of the variables.
pairs(∼ mpg + displacement + horsepower + weight +
acceleration , Auto)
identify each point
> plot(horsepower ,mpg)
> identify (horsepower ,mpg ,name)
Then clicking on a given point in the plot will cause R to print the value of the variable of interest.
Summary
summary (Auto)
summary (mpg)
gives out average, min, median...
Save
Once we have finished using R, we type q() in order to shut it down, or q() quit. When exiting R, we have the option to save the current workspace so workspace that all objects (such as data sets) that we have created in this R session
will be available next time. Before exiting R, we may want to save a record of all of the commands that we typed in the most recent session; this can be accomplished using the savehistory() function. Next time we enter R, savehistory()
we can load that history using the loadhistory() function.
标签:
原文地址:http://www.cnblogs.com/jiajiaxingxing/p/4675172.html