标签:
1.把echarts和ZRender下载到本地新建文件夹
echarts下载:http://echarts.baidu.com/index.html
ZRender下载:http://ecomfe.github.io/zrender
2.然后新建一个html文件,代码如下所示:
  1 <!DOCTYPE html>
  2 <head>
  3     <meta charset="utf-8">
  4     <title>ECharts</title>
  5 </head>
  6 <body>
  7     <!-- 为ECharts准备一个具备大小(宽高)的Dom -->
  8     <div id="main" style="height:600px"></div>
  9     <!-- ECharts单文件引入 -->
 10     <script src="echarts/build/dist/echarts.js"></script>
 11     <script type="text/javascript">
 12         // 路径配置
 13         require.config({
 14             paths: {
 15                 echarts: ‘echarts/build/dist‘//echarts的读取目录
 16             }
 17         });
 18
 19         // 使用(注意,的使用)
 20         require(
 21             [
 22                 ‘echarts‘,
 23                 ‘echarts/chart/line‘, //使用折线图就加载line模块,按需加载
 24                 ‘echarts/chart/funnel‘,
 25                 ‘echarts/chart/pie‘//使用柱状图就加载bar模块,按需加载
 26
 27             ],
 28             function (ec) {
 29                 // 基于准备好的dom,初始化echarts图表
 30                 var myChart = ec.init(document.getElementById(‘main‘),‘macarons‘);
 31                 //option部分是图表的关键代码
 32                 var option = {
 33     title : {
 34         //主标题文本,‘\n‘指定换行
 35         text: ‘某站点用户访问来源‘,
 36         //副标题文本
 37         subtext: ‘纯属虚构‘,
 38         //水平安放位置,默认为左侧
 39         x:‘center‘,
 40         //水平对齐方式,默认根据x设置自动调整
 41         textAlign:‘center‘,
 42         //主标题文本样式
 43         textStyle:{ color: ‘#000‘}
 44     },
 45     //提示框,鼠标悬浮交互时的信息提示。
 46     tooltip : {
 47         //触发类型
 48         trigger: ‘item‘,
 49         //内容格式器
 50         formatter: "{a} <br/>{b} : {c} ({d}%)"
 51     },
 52     //图例,每个图表最多仅有一个图例
 53     legend: {
 54         //布局方式,默认为水平布局,可选为:‘horizontal‘ | ‘vertical‘
 55         orient : ‘vertical‘,
 56         //水平安放位置,默认为全图居中
 57         x : ‘left‘,
 58         //图例内容数组
 59         data:[ {name:‘直接访问‘,textStyle : { color: ‘#333‘} } ,‘邮件营销‘,‘联盟广告‘,‘视频广告‘,‘搜索引擎‘]
 60     },
 61     //工具箱,每个图表最多仅有一个工具箱
 62     toolbox: {
 63         show : true,
 64         feature : {
 65             //辅助线标志
 66             mark : {show: true},
 67             //数据视图
 68             dataView : {show: true, readOnly: false},
 69             //动态类型切换
 70             magicType : {
 71                 show: true,
 72                 type: [‘line‘, ‘funnel‘],
 73                 option: {
 74                     funnel: {
 75                         x: ‘25%‘,
 76                         width: ‘50%‘,
 77                         funnelAlign: ‘left‘,
 78                         max: 1548
 79                     }
 80                 }
 81             },
 82             //还原,复位原始图表
 83             restore : {show: true},
 84             //保存图片
 85             saveAsImage : {show: true}
 86         }
 87     },
 88     //是否启用拖拽重计算特性,默认关闭
 89     calculable : true,
 90     //驱动图表生成的数据内容数组
 91     series : [
 92         {
 93             name:‘访问来源‘,
 94             type:‘pie‘,
 95             //半径
 96             radius : ‘55%‘,
 97             //圆心坐标
 98             center: [‘50%‘, ‘60%‘],
 99             data:[
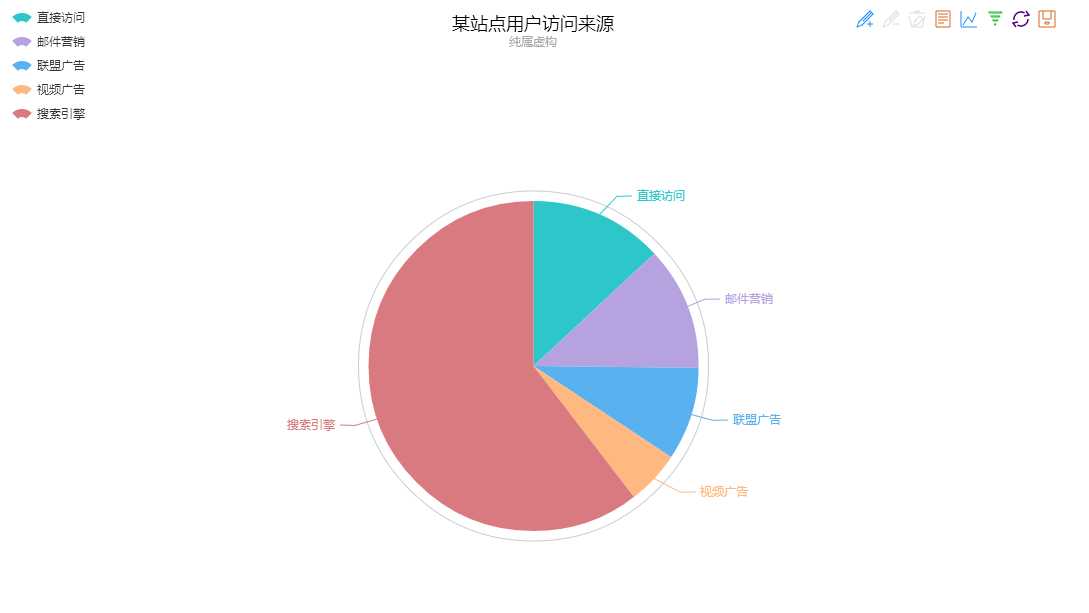
100                 {value:335, name:‘直接访问‘},
101                 {value:310, name:‘邮件营销‘},
102                 {value:234, name:‘联盟广告‘},
103                 {value:135, name:‘视频广告‘},
104                 {value:1548, name:‘搜索引擎‘}
105             ]
106         }
107     ]
108 };
109
110
111
112
113                 // 为echarts对象加载数据
114                 myChart.setOption(option);
115             }
116         );
117     </script>
118 </body>
运行效果图如下:

标签:
原文地址:http://www.cnblogs.com/isonre/p/4721057.html