标签:
1.判断是否适合做主成份分析,变量标准化
Kaiser-Meyer-Olkin抽样充分性测度也是用于测量变量之间相关关系的强弱的重要指标,是通过比较两个变量的相关系数与偏相关系数得到的。
KMO介于0于1之间。KMO越高,表明变量的共性越强。如果偏相关系数相对于相关系数比较高,则KMO比较低,主成分分析不能起到很好的数据约化效果。
根据Kaiser(1974),一般的判断标准如下:
0.00-0.49,不能接受(unacceptable);
0.50-0.59,非常差(miserable);
0.60-0.69,勉强接受(mediocre);
0.70-0.79,可以接受(middling);
0.80-0.89,比较好(meritorious);
0.90-1.00,非常好(marvelous)。
SMC即一个变量与其他所有变量的复相关系数的平方,也就是复回归方程的可决系数。
SMC比较高表明变量的线性关系越强,共性越强,主成分分析就越合适。
. estat smc
. estat kmo
. estat anti//暂时不知道这个有什么用
得到结果,说明变量之间有较强的相关性,适合做主成份分析。
Squared multiple correlations of variables with all other variables

    -----------------------
        Variable |     smc
    -------------+---------
              x1 |  0.8923
              x2 |  0.9862
              y1 |  0.9657
              y2 |  0.9897
              y3 |  0.9910
              y4 |  0.9898
              y5 |  0.9769
              y6 |  0.9859
              y7 |  0.9735
    -----------------------
变量标准化
. egen z1=std(x1)
2.对变量进行主成份分析
. pca x1 x2 y1 y2 y3 y4 y5 y6 y7
. pca x1 x2 y1 y2 y3 y4 y5 y6 y7, comp(1)
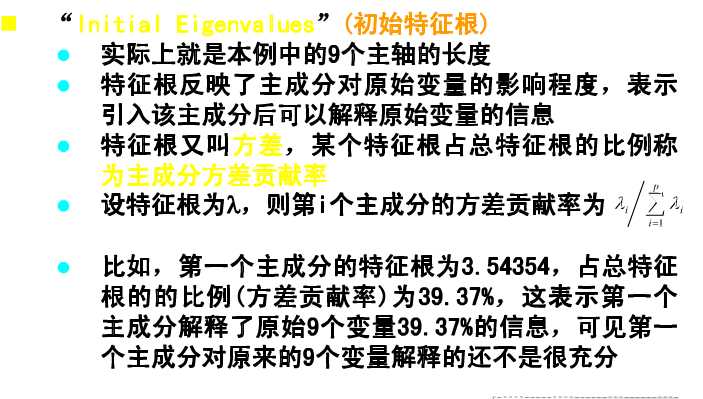
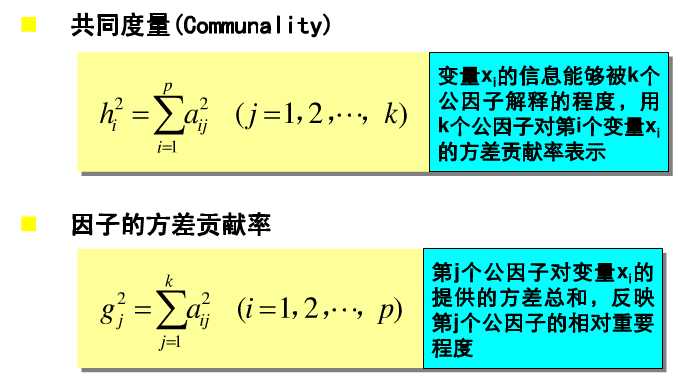
得到下面两个表格,第一个表格中的各项分别为特征根、difference这个不知道是啥、方差贡献率、累积方差贡献率。
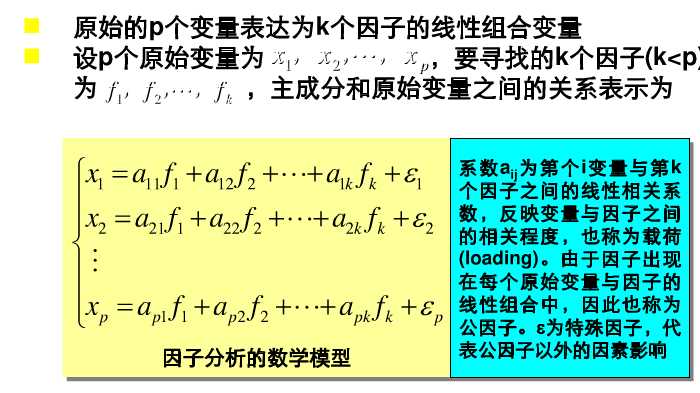
*第二个表格即为因子载荷矩阵,它和SPSS中的成份矩阵和成份得分系数矩阵的关系为:
成份矩阵/sqrt(对应的特征值)=因子载荷矩阵=sqrt(对应的特征值)*成份得分系数矩阵
*系数越大,说明主成份对该变量的代表性越大。
Principal components/correlation                  Number of obs    =        19
                                                  Number of comp.  =         9
                                                  Trace            =         9
    Rotation: (unrotated = principal)             Rho              =    1.0000

    --------------------------------------------------------------------------
       Component |   Eigenvalue     Difference         Proportion   Cumulative
    -------------+------------------------------------------------------------
           Comp1 |      7.57604      6.59246             0.8418       0.8418
           Comp2 |      .983579      .731224             0.1093       0.9511
           Comp3 |      .252355      .162221             0.0280       0.9791
           Comp4 |     .0901337     .0323568             0.0100       0.9891
           Comp5 |     .0577769     .0387149             0.0064       0.9955
           Comp6 |      .019062    .00931458             0.0021       0.9977
           Comp7 |    .00974741    .00259494             0.0011       0.9987
           Comp8 |    .00715247    .00299772             0.0008       0.9995
           Comp9 |    .00415475            .             0.0005       1.0000
    --------------------------------------------------------------------------

Principal components (eigenvectors)

    ----------------------------------------------------------------------------------------------------------------------
        Variable |    Comp1     Comp2     Comp3     Comp4     Comp5     Comp6     Comp7     Comp8     Comp9 | Unexplained
    -------------+------------------------------------------------------------------------------------------+-------------
              x1 |   0.1292    0.9388    0.1499    0.0240    0.0387    0.1398    0.2098    0.0776    0.0884 |           0
              x2 |   0.3485    0.2337   -0.2455    0.1139    0.1515   -0.4559   -0.6523   -0.2378   -0.1946 |           0
              y1 |   0.3482   -0.0578    0.4193    0.1836   -0.7127    0.1420   -0.2687    0.2227   -0.1264 |           0
              y2 |   0.3476   -0.1604    0.4115    0.3539    0.1732   -0.1441    0.2073   -0.4811    0.4834 |           0
              y3 |   0.3528   -0.1002    0.3289   -0.3145    0.3512    0.2787    0.1233   -0.2021   -0.6335 |           0
              y4 |   0.3566   -0.1297    0.1355   -0.1226    0.3995   -0.2039   -0.0372    0.7516    0.2350 |           0
              y5 |   0.3505   -0.0056   -0.2152   -0.7536   -0.3081   -0.0449    0.0658   -0.2047    0.3460 |           0
              y6 |   0.3523   -0.0477   -0.4099    0.2705   -0.2076   -0.3276    0.6130    0.0922   -0.3127 |           0
              y7 |   0.3482   -0.0761   -0.4809    0.2693    0.1291    0.7093   -0.1366    0.0146    0.1750 |           0
    ----------------------------------------------------------------------------------------------------------------------
. estat loading,cnorm(eigen)
利用上述命令可以得到SPSS中的成分矩阵
Principal component loadings (unrotated)
    component normalization: sum of squares(column) = eigenvalue

    --------------------------------------------------------------------------------------------------------
                 |    Comp1     Comp2     Comp3     Comp4     Comp5     Comp6     Comp7     Comp8     Comp9
    -------------+------------------------------------------------------------------------------------------
              x1 |    .3556     .9311    .07533   .007206   .009293     .0193    .02071   .006566   .005701
              x2 |    .9591     .2318    -.1233    .03421    .03642   -.06295    -.0644   -.02011   -.01254
              y1 |    .9584   -.05736     .2106    .05512    -.1713     .0196   -.02653    .01884  -.008146
              y2 |    .9568     -.159     .2067     .1062    .04163    -.0199    .02047   -.04069    .03116
              y3 |    .9712   -.09934     .1652   -.09441    .08441    .03848    .01218   -.01709   -.04083
              y4 |    .9814    -.1286    .06808   -.03679    .09602   -.02815   -.00367    .06357    .01515
              y5 |    .9647  -.005542    -.1081    -.2262   -.07406  -.006196   .006492   -.01731     .0223
              y6 |    .9696   -.04732    -.2059    .08121   -.04991   -.04523    .06052   .007799   -.02015
              y7 |    .9584   -.07548    -.2416    .08084    .03102    .09793   -.01348   .001237    .01128
    --------------------------------------------------------------------------------------------------------

.


3.画碎石图
. screeplot
4.画载荷图
. loadingplot
5.因子分析


. factor x1 x2 y1 y2 y3 y4 y5 y6 y7, pcf
(obs=19)

Factor analysis/correlation                        Number of obs    =       19
    Method: principal-component factors            Retained factors =        1
    Rotation: (unrotated)                          Number of params =        9

    --------------------------------------------------------------------------
         Factor  |   Eigenvalue   Difference        Proportion   Cumulative
    -------------+------------------------------------------------------------
        Factor1  |      7.57604      6.59246            0.8418       0.8418
        Factor2  |      0.98358      0.73122            0.1093       0.9511
        Factor3  |      0.25235      0.16222            0.0280       0.9791
        Factor4  |      0.09013      0.03236            0.0100       0.9891
        Factor5  |      0.05778      0.03871            0.0064       0.9955
        Factor6  |      0.01906      0.00931            0.0021       0.9977
        Factor7  |      0.00975      0.00259            0.0011       0.9987
        Factor8  |      0.00715      0.00300            0.0008       0.9995
        Factor9  |      0.00415            .            0.0005       1.0000
    --------------------------------------------------------------------------
    LR test: independent vs. saturated:  chi2(36) =  358.55 Prob>chi2 = 0.0000

Factor loadings (pattern matrix) and unique variances

    ---------------------------------------
        Variable |  Factor1 |   Uniqueness
    -------------+----------+--------------
              x1 |   0.3556 |      0.8736
              x2 |   0.9591 |      0.0801
              y1 |   0.9584 |      0.0816
              y2 |   0.9568 |      0.0845
              y3 |   0.9712 |      0.0568
              y4 |   0.9814 |      0.0368
              y5 |   0.9647 |      0.0693
              y6 |   0.9696 |      0.0599
              y7 |   0.9584 |      0.0815
    ---------------------------------------
利用predict命令可以直接得到SPSS中的成分得分系数矩阵,也就是基于factor命令将变量标准化
. predict f1
(regression scoring assumed)

Scoring coefficients (method = regression)

    ------------------------
        Variable |  Factor1
    -------------+----------
              x1 |  0.04693
              x2 |  0.12660
              y1 |  0.12650
              y2 |  0.12630
              y3 |  0.12819
              y4 |  0.12954
              y5 |  0.12734
              y6 |  0.12798
              y7 |  0.12651
    ------------------------
标签:
原文地址:http://www.cnblogs.com/pursuit1996/p/4728353.html